AWS Cost Explorer for Tactical and Strategic Cost Management
Amazon Web Services (AWS) Cost Explorer is an integral tool for organizations seeking to gain comprehensive visibility and control over their cloud expenditures and in-depth analysis of AWS costs and usage patterns over time.


Amazon Web Services (AWS) Cost Explorer is an integral tool for organizations seeking to gain comprehensive visibility and control over their cloud expenditures. It provides a user-friendly interface equipped with interactive graphs, detailed charts, and customizable reporting features, enabling in-depth analysis of AWS costs and usage patterns over time. Key functionalities include robust cost visualization, predictive forecasting, actionable cost optimization recommendations, and the ability to generate bespoke reports tailored to specific analytical needs. Furthermore, Cost Explorer seamlessly integrates with other AWS services, such as AWS Budgets for proactive alerting and AWS Cost Anomaly Detection for identifying unusual spending.
Users can typically access cost and usage data for the preceding 12 to 13 months and obtain forecasts extending 12 months into the future. Cost data within the platform is refreshed at least once every 24 hours, ensuring that the information is relatively current. While the core features of Cost Explorer are available at no additional charge, advanced capabilities, such as hourly and resource-level granularity for cost analysis, may incur supplementary fees.
The 24-hour data refresh cycle is a significant consideration, particularly for dynamic data engineering workloads. Data processing jobs, such as those run on Amazon EMR or AWS Glue, can consume resources rapidly. Should a job malfunction or be inadvertently over-provisioned, substantial costs could accrue within a few hours. Relying solely on Cost Explorer's daily update cycle to detect such issues introduces a potential 24-hour window of overspending. This inherent latency underscores the importance of augmenting Cost Explorer with more immediate monitoring mechanisms, like Amazon CloudWatch metrics and alarms, or leveraging more frequent AWS Cost and Usage Report (CUR) data exports for timely operational control over cost components that exhibit high volatility.
1.2. Why Cost Management is Critical for Data Engineering Workloads
Data engineering workloads, which frequently utilize resource-intensive services such as Amazon EMR, AWS Glue, Amazon S3, Amazon Kinesis, and Amazon Redshift, have the potential to generate substantial and often fluctuating costs. The inherent flexibility of the cloud's pay-as-you-go pricing model, while advantageous, can also lead to unpredictable expenditures if not managed with diligence and foresight. Unchecked cloud spending can significantly impact profitability and divert resources from innovation.
Implementing effective cost management practices empowers data teams to optimize resource allocation, substantiate infrastructure decisions, meticulously track the return on investment (ROI) for various data projects, and cultivate a pervasive culture of cost accountability within the organization.
For data engineering initiatives, the objective of cost management extends beyond mere bill reduction. It encompasses maximizing the value derived—whether in the form of insights, enhanced performance, or improved reliability—from every dollar invested in the data infrastructure. This necessitates a continuous, iterative cycle of monitoring, in-depth analysis, targeted optimization, and strategic architectural refinement. AWS Cost Explorer serves as a foundational tool in this process, providing the essential data and visibility required to navigate this cycle effectively. The aim is not simply to minimize costs, as this could potentially compromise data quality, processing velocity, or the availability of crucial insights. Instead, the focus is on achieving cost efficiency and value optimization: delivering the desired data engineering outcomes at the lowest feasible and sustainable expenditure. Cost Explorer offers the initial, critical view into "what" is being spent, which is the first step toward understanding "why" these costs are incurred and "how" this value equation can be improved.
1.3. Enabling and Navigating Cost Explorer
AWS Cost Explorer is activated through the AWS Billing and Cost Management console ; notably, it cannot be enabled via the AWS API. Upon activation, AWS initiates a process to prepare cost data for the current month and the preceding 12 months, concurrently calculating a forecast for the subsequent 12 months. Data pertaining to the current month typically becomes accessible within approximately 24 hours, while the collation of the remaining historical data may require several additional days.
The main Cost Explorer dashboard furnishes users with a consolidated overview of monthly expenditures, prevailing cost trends, and forecasted future spending. From this vantage point, users can employ a variety of exploration tools and pre-configured reports to delve deeper into their cost data.
It is important to recognize that the initial data preparation phase following the enablement of Cost Explorer implies a delay. Consequently, for newly established AWS accounts or immediately after activating the service, comprehensive historical analysis and dependable forecasting capabilities will not be instantaneously available. Data engineering teams should incorporate this initial lag into their early-stage cost monitoring strategies. For new projects or deployments, initial cost tracking might need to rely on more rudimentary billing data or real-time CloudWatch metrics until Cost Explorer's data repository is fully populated and stabilized.
2. Tactical Cost Management with AWS Cost Explorer for Data Operations
Tactical cost management involves the day-to-day monitoring and control of cloud expenditures. For data operations, this means using AWS Cost Explorer to understand current spending, identify inefficiencies, and react quickly to unexpected cost variations.
2.1. Visualizing and Understanding Current Costs
A primary function of Cost Explorer is to provide clear visualizations of current and historical AWS spending, enabling data teams to grasp their financial footprint.
2.1.1. Using Default Reports (Daily, Monthly, Service-Specific)
AWS Cost Explorer offers a suite of default reports that serve as effective initial tools for cost analysis. These include reports such as "Daily Costs," "Monthly Costs by Linked Account," "Monthly Costs by Service," and "Monthly EC2 Running Hours Costs and Usage." The "Daily Costs" report, for instance, displays expenditure for the last six months and provides a forecast for the upcoming month. Similarly, the "Monthly costs by service" and "by linked account" reports highlight the top five contributors in each category, amalgamating the remainder into a single group. These pre-configured views are instrumental in rapidly identifying principal cost drivers and recent spending trends.
While these default reports offer convenience for obtaining a high-level overview, data engineering workloads often encompass a diverse array of services. The "top five" summarization in certain reports might inadvertently obscure costs originating from services that, while not dominant in overall AWS spending, are nonetheless significant contributors to the data engineering budget. For a comprehensive understanding of data engineering-specific costs, it is often necessary to progress beyond default reports and utilize custom reporting or more granular filtering capabilities. For example, a data engineering stack might utilize Amazon S3, AWS Glue, Amazon EMR, Amazon Kinesis, AWS Lambda, and Amazon Redshift. Not all of these might feature in the "top 5" of total AWS expenditure, yet their cumulative cost could be substantial for the data team. Thus, relying exclusively on default reports could lead to an incomplete assessment of data engineering costs, necessitating the use of advanced filtering and custom reports to isolate and analyze the specific service portfolio relevant to data operations.
2.1.2. Interpreting Cost and Usage Graphs
Cost Explorer employs interactive graphs, including bar charts, line graphs, and stacked charts, to visually represent cost and usage data over specified periods. These visualizations allow users to analyze critical metrics such as month-to-date costs, forecasted month-end expenditures, and comparisons with previous periods. Proficiency in interpreting these graphical representations is fundamental for effectively identifying trends, anomalous spikes, and other noteworthy patterns in spending.
The visual efficacy of Cost Explorer graphs is undeniable; however, it is crucial to correlate cost graphs with corresponding usage graphs. A discernible spike in costs might be attributable to a legitimate increase in usage, reflecting heightened demand, or it could stem from a price adjustment or an underlying inefficiency, such as the unintentional deployment of a more expensive storage tier or instance type. Without a concurrent examination of both cost and usage dimensions, misinterpretations regarding the drivers of financial changes can arise. For example, if costs escalate while usage remains static, this could signal a change in pricing models, accidental provisioning of premium services, or inefficient resource configurations. Conversely, if costs and usage increase proportionally, it generally indicates genuine workload growth. Therefore, a thorough tactical analysis necessitates an evaluation of both cost and usage data to accurately diagnose the root causes of any observed variations.
2.2. Granular Analysis with Filtering and Grouping
The true analytical power of Cost Explorer is unlocked through its sophisticated filtering and grouping functionalities, which allow for nuanced examination of cost data.
2.2.1. Filtering by Service, Account, Region, Tags, Cost Categories
Cost Explorer offers extensive filtering capabilities across numerous dimensions. Users can dissect their costs by AWS Service (e.g., isolating AWS Glue, Amazon EMR, or Amazon S3), Linked Account, AWS Region, API Operation, Availability Zone, Charge Type, Instance Type, and specific Usage Types. Critically for data engineering, filtering can also be applied based on custom Cost Allocation Tags and AWS Cost Categories. This allows data engineers to isolate expenditures associated with particular data projects, distinct environments (such as development, testing, or production), or individual data pipelines by applying precisely defined tag filters. AWS Cost Categories further enhance this by enabling the grouping of costs according to organization-specific business rules, thereby mapping AWS expenditures to internal structures like specific teams or business units.
The utility of these filtering mechanisms, particularly those based on tags and Cost Categories, is directly proportional to the rigor and consistency of the underlying tagging strategy and Cost Category rule configurations. In the absence of a disciplined and systematically applied tagging regimen, achieving granular cost attribution for distinct data pipelines or projects within Cost Explorer becomes exceedingly challenging, if not impossible. For instance, to ascertain the total cost of a "Pipeline X," all its constituent resources—which might span multiple services like an S3 bucket, Glue jobs, an EMR cluster, and Lambda functions—must be consistently tagged with a common identifier (e.g., a tag with the key pipeline and value pipeline-x). If tagging practices are inconsistent, incomplete, or employ varied naming conventions (e.g., Pipeline:X versus pipeline_x), the resulting filtered views will be inaccurate or partial. Consequently, a proactive and rigorously enforced tagging strategy is an essential prerequisite for leveraging Cost Explorer to conduct meaningful, granular cost analysis for data engineering workloads.
2.2.2. Grouping by Dimensions for Deeper Insights
Complementing its filtering capabilities, Cost Explorer's grouping function allows users to aggregate costs along selected dimensions, thereby offering varied perspectives on the data. This feature is instrumental in revealing underlying cost structures and drivers. For example, after applying a filter for "Service: Amazon S3," an engineer could then group these S3-specific costs by "Usage Type." This would provide a detailed breakdown of S3 expenditures, such as storage costs (e.g., S3 Standard, S3 Intelligent-Tiering), request costs (e.g., GET, PUT), and data transfer costs. Alternatively, grouping by a custom tag like "Tag: Project" would display S3 costs allocated to each tagged project.
The combination of filtering and grouping facilitates a powerful, iterative approach to cost analysis. A data engineer might initiate an investigation by filtering for Service: Amazon EMR to focus on EMR-related expenses. Subsequently, they could group these costs by Instance Type to identify which EMR node families are contributing most significantly to the bill. To further refine the analysis, they might apply an additional filter for a specific Tag: PipelineID and then group by Day to observe the daily cost profile of EMR clusters associated with a particular data pipeline. This methodical, multi-step drill-down process is highly effective in uncovering layers of detail and pinpointing specific areas that may warrant optimization or further investigation.
2.3. Identifying and Addressing Cost Anomalies
A critical aspect of tactical cost management is the prompt identification and remediation of cost anomalies—unexpected deviations from normal spending patterns.
2.3.1. Leveraging AWS Cost Anomaly Detection
AWS Cost Anomaly Detection is a service that employs machine learning algorithms to automatically identify unusual spending patterns and alert users to unexpected escalations in costs. This service can be configured to monitor expenditures across all AWS services, specific member accounts within an AWS Organization, designated cost allocation tags, or defined AWS Cost Categories. The setup process involves creating "cost monitors" tailored to the desired scope and configuring "alert subscriptions" to define notification preferences. Alerts can be disseminated via email or through Amazon Simple Notification Service (SNS) topics. The service operates by establishing a baseline of typical cost behavior and subsequently flagging any significant deviations from this established norm.
When configuring Cost Anomaly Detection specifically for data infrastructure, it is highly advisable to create monitors that are scoped to data engineering services (e.g., a dedicated monitor for "Service: AWS Glue" or "Service: Amazon EMR") or that utilize tags identifying specific data pipelines or projects. A generic, account-wide anomaly detection setup might fail to flag subtle yet significant cost spikes within the data engineering budget if the overall account expenditure is considerably larger. For example, an anomaly in AWS Glue costs might be critically important for the data team but could be too small in magnitude to trigger an account-level anomaly alert if, for instance, EC2 spending is several orders of magnitude higher. Therefore, to ensure effective detection of anomalies pertinent to data infrastructure, monitors should be precisely scoped to data engineering services or to tags that delineate data projects or pipelines. This targeted approach ensures that alerts are relevant and actionable for the data team.
2.3.2. Investigating Spikes and Unexpected Charges
Upon detection of an anomaly by the AWS Cost Anomaly Detection service, or when a cost spike is visually identified in Cost Explorer graphs, the tool provides capabilities to drill down and investigate the underlying cause. By systematically applying filters for specific date ranges, services, and other relevant dimensions, users can effectively pinpoint the source of the unexpected charge. Furthermore, the Cost Anomaly Detection service itself often provides a root cause analysis, which can help identify the particular resources or services responsible for the aberrant spending.
For data processing jobs, such as those executed on Amazon EMR or AWS Glue, a cost spike frequently correlates with factors like increased job runtimes, larger volumes of data being processed, or inefficient configurations (e.g., excessive allocation of Data Processing Units (DPUs) or nodes, suboptimal code execution). When investigating such spikes observed in Cost Explorer, it is essential to complement this financial data with an examination of corresponding job logs, Amazon CloudWatch metrics (monitoring CPU/memory utilization, I/O operations), and, if available, data from application performance monitoring (APM) tools. This integrated approach allows for a comprehensive understanding of the technical root cause that manifested as a financial symptom. For instance, Cost Explorer might indicate an EMR cost spike and perhaps identify the specific cluster or usage type. However, to determine if this was due to inefficient Spark code, an incorrect instance type selection for the workload, the processing of an unexpectedly large dataset, or a job that became unresponsive, data engineers must correlate the Cost Explorer findings with operational data from EMR logs and CloudWatch performance metrics. This holistic view is crucial for accurate root cause analysis and the implementation of effective and lasting remediations.
2.4. Optimizing Resource Utilization
Identifying and rectifying suboptimal resource utilization is a key tactical approach to controlling data engineering costs.
2.4.1. Identifying Idle and Underutilized Resources
AWS Cost Explorer, often used in conjunction with AWS Trusted Advisor, plays a role in identifying resources that are idle or underutilized, such as Amazon EC2 instances, Amazon EBS volumes, or Elastic Load Balancers. Within the context of data engineering, this could translate to pinpointing Amazon EMR clusters that remain active after job completion, underutilized nodes in an Amazon Redshift cluster, or unattached EBS volumes that were previously associated with terminated data processing instances.
The concept of "idle" for data engineering resources can be nuanced and requires careful consideration of workload patterns and business requirements, rather than relying solely on raw utilization metrics from Cost Explorer. For example, an Amazon Kinesis stream exhibiting low average traffic might appear underutilized but could be indispensable for a critical real-time alerting pipeline that experiences intermittent bursts of essential data. Similarly, an EMR cluster might be intentionally idle between scheduled batch processing jobs, provisioned to handle peak loads. In such cases, optimization might involve exploring more flexible scheduling options or transitioning to serverless alternatives like EMR Serverless or AWS Glue, rather than simple decommissioning. Therefore, utilization data from Cost Explorer should serve as an initial trigger for investigation, which must then be informed by domain-specific knowledge of the data pipeline's function and performance characteristics.
2.4.2. Rightsizing Recommendations for Compute Services
AWS Cost Explorer offers rightsizing recommendations specifically for Amazon EC2 instances, suggesting more cost-effective instance types based on observed historical usage patterns. This feature is particularly pertinent for data engineering services that are commonly backed by EC2 instances, such as Amazon EMR clusters and provisioned Amazon Redshift nodes. For more comprehensive recommendations, including those that span different instance families and cater to Auto Scaling groups, AWS Compute Optimizer is a complementary service.
When rightsizing instances for data processing workloads like EMR nodes or Redshift compute nodes, it is crucial to consider factors beyond just CPU and memory utilization. I/O performance, network bandwidth, and specific instance features (e.g., local NVMe storage for EMR Spark shuffle operations) are often critical determinants of pipeline performance. While Cost Explorer's recommendations provide a valuable starting point, data engineers must meticulously validate these suggestions against the specific performance prerequisites of their workloads. Opting for a "cheaper" instance, as suggested by generic utilization metrics, could inadvertently cripple a data pipeline if the chosen instance lacks the necessary I/O capacity or other performance characteristics, potentially leading to longer job durations and negating or even reversing cost savings. For example, if Cost Explorer suggests downsizing an m5.2xlarge EMR core node to an m5.xlarge based on average CPU/memory usage, but the m5.2xlarge was initially selected for its superior EBS bandwidth crucial during peak data shuffling, the change could severely degrade EMR job performance. Such a slowdown might increase overall job duration, consuming more DPU-hours or node-hours, and thus potentially increasing total costs despite the lower per-instance-hour rate.
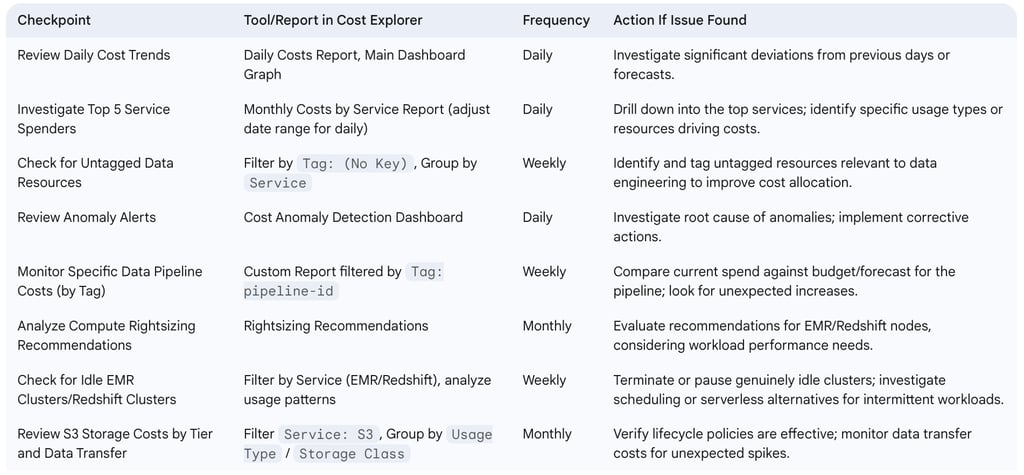
The following table provides a checklist for tactical cost monitoring within data operations:
Table: Tactical Cost Monitoring Checklist for Data Operations
3. Strategic Cost Management and Planning with AWS Cost Explorer
Strategic cost management extends beyond immediate operational control, focusing on long-term planning, budgeting, and architectural decisions that influence future cloud expenditures. AWS Cost Explorer offers several features that support these strategic endeavors for data engineering initiatives.
3.1. Forecasting Costs for Data Initiatives
Accurate forecasting is fundamental to effective budget planning and resource allocation for both ongoing and new data projects.
3.1.1. Understanding Cost Explorer's Forecasting Capabilities
AWS Cost Explorer leverages historical cost and usage data, typically spanning up to the last 12 months, to generate forecasts of future AWS expenditures for the subsequent 12 months. These forecasts are commonly presented with a prediction interval, often 80%, which delineates the range within which actual costs are statistically likely to fall. Users can view these forecasts at a high, account-wide level or apply filters—such as by service, account, or tags—to predict costs for specific components or projects.
The reliability of Cost Explorer's forecasts is heavily contingent upon the stability and volume of the available historical data. For data engineering workloads that are highly dynamic, or for new services and projects with limited historical cost data, the generated forecasts will inherently be less precise. It is also noteworthy that the default 80% prediction interval is a fixed parameter and cannot be adjusted by the user. This implies that for new data initiatives, such as the launch of a new data lake or a large-scale machine learning training pipeline, which lack a substantial historical cost footprint, Cost Explorer's automated forecasting will initially be inaccurate or potentially unavailable. Consequently, for budgeting these new ventures, teams must rely on alternative methods like the AWS Pricing Calculator or manual estimations based on anticipated resource consumption. As these new initiatives accrue actual cost data over time, Cost Explorer's forecasts will gradually become more reliable. For risk-averse planning scenarios, organizations should consider the upper bound of the provided forecast range, keeping in mind the inability to request a higher confidence interval (e.g., 95%) directly within the tool.
3.1.2. Budgeting for New Projects and Platform Scaling
While Cost Explorer's forecasting is primarily based on historical data, these insights can effectively inform budget setting for the scaling of existing data platforms where usage patterns exhibit a degree of predictability. However, for entirely new data initiatives, the utility of Cost Explorer's forecasting feature is diminished due to the absence of this historical context. In such cases, initial budget formulation would more heavily depend on tools like the AWS Pricing Calculator and estimations derived from anticipated usage and architectural design. Once these new projects are launched and begin incurring costs, Cost Explorer becomes invaluable for tracking actual expenditures against these initial budgetary allocations. The consistent application of cost allocation tags is crucial in this phase, as it allows for the distinct tracking of costs associated with new projects or initiatives. This, in turn, enables Cost Explorer to monitor their specific spending patterns and, eventually, to generate more accurate forecasts for their future costs as a sufficient volume of historical data accumulates.
A robust strategic approach involves a phased budgeting process for new data initiatives.
Phase 1 (Conception & Estimation): During the initial planning stages, project costs are estimated using the AWS Pricing Calculator, expert judgment, and cost data from analogous past projects.
Phase 2 (Launch & Initial Monitoring): The initiative is launched with a rigorous tagging strategy in place. Actual spending is closely monitored in Cost Explorer, often on a daily or weekly basis, to quickly identify any deviations from initial estimates.
Phase 3 (Refinement & Forecasting): After a period of operation, typically one to three months, sufficient actual cost data for the newly tagged resources accumulates. At this point, Cost Explorer's forecasting capabilities can generate more reliable predictions specific to the new initiative. These forecasts are then used to refine rolling budgets and to compare against, and learn from, the initial estimates, thereby improving the accuracy of future budgeting exercises.
3.2. Optimizing with Reserved Instances (RIs) and Savings Plans
For data engineering workloads that involve sustained usage of EC2-backed services, Reserved Instances (RIs) and Savings Plans (SPs) are key instruments for strategic cost optimization.
3.2.1. Analyzing RI and Savings Plans Coverage and Utilization Reports
AWS Cost Explorer provides dedicated reports designed to help users analyze the utilization and coverage of their RI and Savings Plan commitments. RI Utilization reports indicate the extent to which purchased RIs are being actively used, while Coverage reports reveal the percentage of eligible instance usage that is being covered by either RIs or Savings Plans. These reports are particularly crucial for managing the costs of data engineering workloads that rely on EC2-backed services, such as Amazon EMR and Amazon Redshift, ensuring that financial commitments translate into effective cost savings. Cost Explorer also allows users to view amortized RI costs, which helps in understanding the effective daily or hourly rate of these reservations by distributing upfront fees over the term of the RI.
When analyzing RI and Savings Plan data for data engineering, especially with services like Amazon EMR, the instance flexibility offered by certain RI types is a key consideration. While an RI might be reported as "utilized" if it covers different instance sizes within the same family (where applicable), data engineers must ensure that the instance types actually being covered by these commitments align with the specific performance requirements of their workloads. Persistently low utilization figures may indicate that purchased capacity is going unused, while low coverage suggests missed opportunities for savings on On-Demand usage. A deeper analysis might reveal a mismatch between the types of instances committed to and the actual instance types required by current data processing jobs, or it could signal a shift in workload patterns that necessitates a re-evaluation of the commitment strategy. For instance, if RIs are for general-purpose instances but EMR jobs now predominantly require memory-optimized instances, the RIs might still show as "utilized" due to instance flexibility, but this would not represent an optimal coverage strategy from either a performance or a specific workload need perspective. Strategic analysis, therefore, involves scrutinizing not just the quantitative metrics (utilization and coverage percentages) but also what types of instances are being utilized or covered and whether this aligns with current and anticipated future data platform requirements.
3.2.2. Leveraging Purchase Recommendations
Cost Explorer actively assists in optimizing commitment-based discounts by providing recommendations for the purchase of RIs and Savings Plans. These recommendations are generated based on an analysis of historical On-Demand instance usage. The system aims to identify the optimal number and type of RIs or the appropriate Savings Plan commitment level to maximize potential savings over continued On-Demand pricing. These recommendations typically consider usage patterns over the last 7, 30, or 60 days.
It is critical to recognize that RI and Savings Plan recommendations from Cost Explorer are inherently backward-looking, as they are derived from past usage data. When strategically planning for new data platforms or anticipating significant architectural transformations—such as migrating a large EMR workload to a new instance family (e.g., from Intel-based to Graviton-based instances) or transitioning from provisioned Redshift clusters to Redshift Serverless—historical data may not accurately reflect future resource needs. Therefore, these recommendations should be treated as valuable guidance rather than definitive purchasing directives. They must be carefully cross-referenced with future architectural roadmaps, anticipated workload changes, and projected usage patterns. For example, if Cost Explorer recommends purchasing RIs for m5.large instances based on past EMR usage, but the data engineering team plans to migrate those EMR jobs to Graviton-based m7g.large instances in the next quarter, acting on the m5.large recommendation would be a strategic misstep. Over-committing to resources based purely on the past usage of a data pipeline component that is slated for decommissioning or significant modification would lead to wasted spend. Thus, the strategic application of these recommendations involves overlaying them with the data platform's future trajectory to ensure that any new commitments align with future stable-state workloads, not just historical ones.
3.3. Informing Data Architecture Decisions
Cost Explorer can provide valuable data to inform strategic architectural decisions for data platforms, helping to balance performance, functionality, and cost.
3.3.1. Comparing Costs of Serverless vs. Cluster-Based Processing (e.g., Glue vs. EMR)
AWS Cost Explorer can be effectively utilized to compare the Total Cost of Ownership (TCO) of different data processing architectural patterns after these patterns have been implemented, even if only in pilot or proof-of-concept phases. By meticulously tagging resources specific to a serverless pipeline (e.g., one using AWS Glue and AWS Lambda) and a comparable cluster-based pipeline (e.g., one using Amazon EMR) performing similar data transformation tasks, their respective costs can be isolated and compared over a defined period within Cost Explorer. The analysis should encompass not only the primary compute costs (such as Glue DPU-hours versus EMR instance-hours) but also associated expenditures for storage (e.g., S3 for staging and output), data transfer, and any ancillary services involved in each pipeline (e.g., CloudWatch Logs, Step Functions orchestration). While Cost Explorer does not directly model "what-if" scenarios for architectures that have not yet been built (a task better suited for the AWS Pricing Calculator ), it serves as a crucial tool for validating the cost assumptions of architectural choices once they are operational.
The cost comparison between serverless data processing (like AWS Glue) and cluster-based processing (like Amazon EMR) is not static; it is heavily influenced by the specific characteristics of the workload. Factors such as workload patterns (spiky and intermittent versus continuous and long-running), processing duration, data volume, and CPU/memory intensity all play significant roles. Cost Explorer can help reveal these cost dynamics in practice. For instance, AWS Glue might prove more economical for infrequent, short-duration jobs due to its per-second billing and lack of idle cluster charges. Conversely, Amazon EMR, particularly when leveraging Spot Instances for task nodes or Reserved Instances for core nodes, could offer better cost-efficiency for long-running, computationally intensive batch processing tasks where economies of scale can be achieved. Strategically, data engineering teams can use the cost data gathered from Cost Explorer—derived from pilot projects or existing representative workloads—to construct an empirical cost model. This model can then inform decisions about which processing paradigm (serverless or cluster-based) is likely to be more cost-effective for new, similar workloads, allowing teams to move beyond purely theoretical cost comparisons and make data-driven architectural choices.
3.3.2. Evaluating Storage Tiering Strategies (e.g., S3 access patterns)
For Amazon S3, a cornerstone of many data lakes and data engineering pipelines, Cost Explorer can display costs broken down by different storage classes (e.g., S3 Standard, S3 Standard-Infrequent Access, S3 Glacier Flexible Retrieval, S3 Glacier Deep Archive) provided that data has already been tiered according to lifecycle policies or manual placement. While Cost Explorer itself does not directly analyze S3 object access patterns to recommend specific storage tiering strategies (this functionality is provided by tools such as S3 Storage Class Analysis and S3 Storage Lens ), the financial outcomes of implementing such lifecycle policies become clearly visible within Cost Explorer. That is, shifts in cost distribution between different storage classes can be tracked and quantified. Data engineers can leverage Cost Explorer to meticulously monitor the financial impact of their S3 lifecycle policies. This includes verifying that data transitions to lower-cost tiers as anticipated and, critically, ensuring that data retrieval costs from colder, archival tiers do not inadvertently negate the storage cost savings, which can occur if access patterns were misjudged.
A strategic and iterative approach to S3 cost optimization involves a continuous feedback loop:
Analyze Access Patterns: Utilize S3 Storage Lens and S3 Storage Class Analysis to understand how frequently data in various buckets and prefixes is being accessed.
Implement Lifecycle Policies: Based on the access pattern analysis, define and implement S3 Lifecycle policies to automatically transition data to more cost-effective storage tiers (e.g., from S3 Standard to S3 Standard-IA after 30 days of no access, then to S3 Glacier Instant Retrieval after 90 days).
Monitor Financial Impact in Cost Explorer: Track S3 costs within Cost Explorer, specifically looking at the breakdown by storage class and by relevant bucket tags. This helps validate that storage costs for warmer tiers are decreasing as expected, and that costs for colder tiers are increasing appropriately. Crucially, monitor retrieval costs associated with colder tiers (e.g., DataTransfer-S3-Glacier-Retrieval-Bytes).
Adjust and Re-analyze: If Cost Explorer data reveals unintended consequences, such as unexpectedly high retrieval fees from an archive tier (suggesting that the data moved there is not as "cold" as initially assessed), or if storage savings are not materializing as projected, adjust the lifecycle policies accordingly. This is followed by a renewed analysis of access patterns to ensure the refined policies align better with actual data usage. This data-driven refinement cycle ensures that storage strategies remain optimal over time.
3.4. Long-Term Trend Analysis and Reporting
Understanding cost trends over extended periods is vital for strategic planning, capacity forecasting, and demonstrating the financial impact of optimization efforts.
3.4.1. Tracking Month-over-Month and Year-over-Year Trends
AWS Cost Explorer allows users to view cost and usage data for up to the last 12-13 months, facilitating both month-over-month (MoM) and year-over-year (YoY) trend analysis. This capability is essential for comprehending the growth in data volumes, the increasing demands on processing capacity, and the overall cost trajectory of the data platform. Identifying these long-term trends provides valuable input for strategic capacity planning and helps in anticipating future budgetary requirements with greater accuracy.
Year-over-year trends are particularly insightful for data engineering workloads because they can effectively reveal seasonality in data processing activities. For example, an e-commerce company might observe significantly higher data processing loads and associated costs during the fourth-quarter holiday retail peak. YoY analysis can also clearly demonstrate the financial impact of major platform upgrades, data migrations, or significant optimization initiatives undertaken in the previous year. This historical context is invaluable for performing more accurate long-range forecasting that may extend beyond Cost Explorer's intrinsic 12-month forecast window. For instance, if MoM trends show fluctuations, a YoY comparison can help determine whether a current month's high cost is a typical occurrence for that specific time of year or if it represents a genuine anomaly requiring investigation. Similarly, if a substantial data platform optimization was implemented six months prior, comparing current costs to those from 12 months ago (pre-optimization) helps to quantify the long-term savings achieved. This strategic perspective informs whether observed cost growth is organic (due to increased data volumes or more users) or if inefficiencies might be re-emerging in the system.
3.4.2. Creating Custom Reports for Strategic Reviews
AWS Cost Explorer enables users to save specific configurations of filters, groupings, and time ranges as custom reports. These saved reports can be tailored to meet the informational needs of different audiences, such as providing a high-level summary of data platform costs for executive management or offering detailed service-level breakdowns for engineering teams. For data engineering purposes, custom reports are invaluable for tracking specific metrics, including:
Cost per individual data pipeline (achieved by filtering on specific pipeline tags).
Expenditures associated with distinct data domains (e.g., using a tag like data-domain:customer_analytics_platform).
Efficiency metrics, such as Amazon EMR cost per terabyte of data processed. (This often requires correlating tagged EMR costs from Cost Explorer with data volume metrics obtained through other means, such as pipeline logs or monitoring systems).
These custom reports can be exported as CSV files, allowing for further analysis in external tools or integration into broader business intelligence reporting systems. It is important to note, however, that Cost Explorer reports can be modified and are therefore not recommended for formal auditing purposes.
Strategic custom reports should be designed to focus on Key Performance Indicators (KPIs) that are directly relevant to data engineering objectives, rather than just presenting raw cost figures. Examples include reports titled "Cost of Staging Environment for Data Pipeline X," "Monthly Spend on Data Ingestion Services," or "Trend of S3 Storage Costs for Processed Data Lake." Adopting clear and consistent naming conventions for saved reports is crucial for maintainability. Furthermore, it is a best practice to regularly review and update these saved reports to ensure they remain relevant and accurate as the data platform evolves and new services or pipelines are introduced. This ensures that strategic reviews are always based on the most current and pertinent cost information.
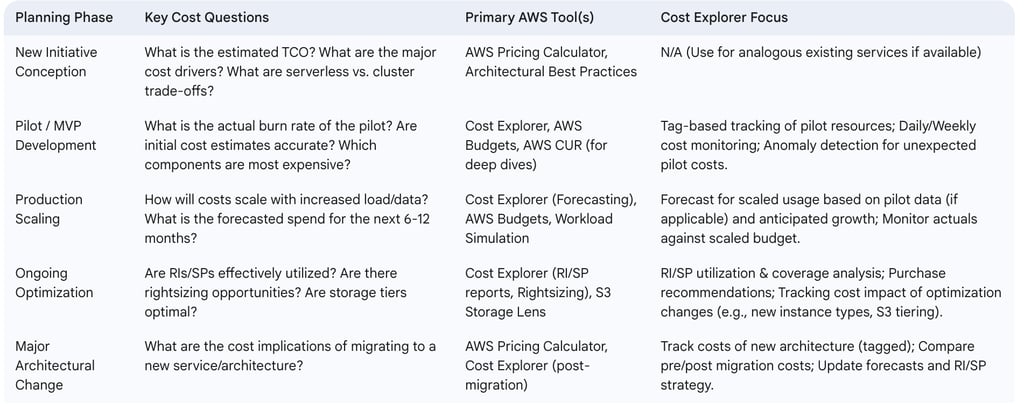
The following table outlines a strategic cost planning framework for data initiatives:
Table: Strategic Cost Planning Framework for Data Initiatives
4. Cost Analysis of Key AWS Data Engineering Services in Cost Explorer
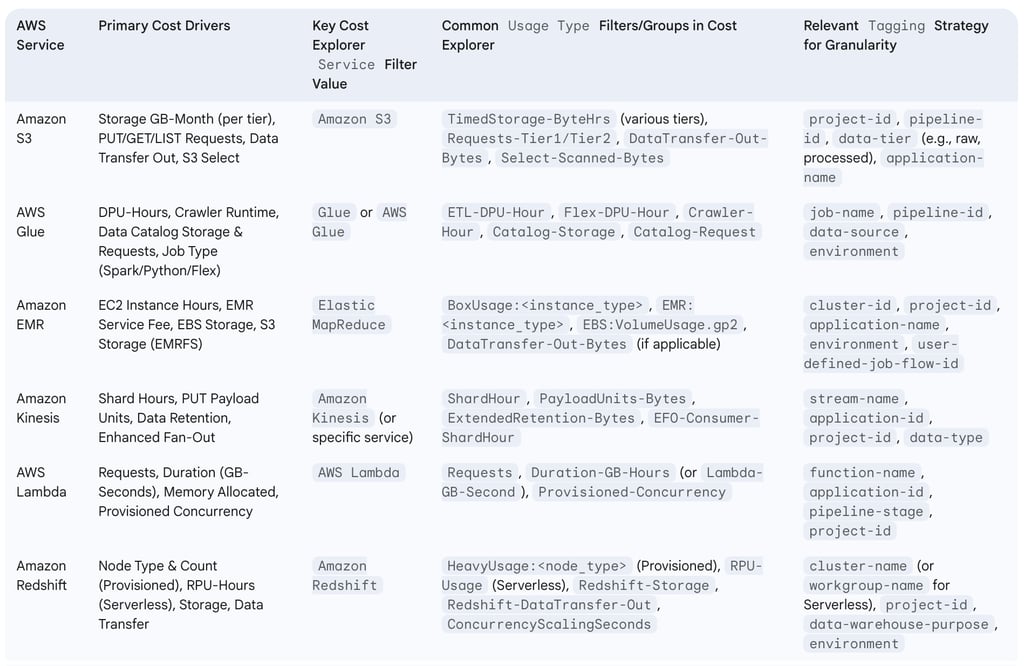
Understanding the cost components of individual AWS services is crucial for effective data engineering cost management. AWS Cost Explorer, with its filtering (by "Service," "Usage Type," "Operation," and relevant tags) and grouping capabilities, allows for detailed dissection of these costs.
4.1. Amazon S3: Storage Classes, Requests, and Data Transfer Costs
Amazon S3 is a foundational service for data lakes and data pipelines, and its costs are driven by several factors: the volume of data stored in various storage classes (e.g., S3 Standard, S3 Standard-Infrequent Access, S3 Glacier Instant Retrieval), the number and type of requests made (e.g., PUT, COPY, POST, GET, LIST), data transfer out of S3 to other regions or the internet, and usage of features like S3 Select, S3 Storage Lens, and S3 Storage Class Analysis.
To analyze S3 costs in Cost Explorer:
Apply a filter for Service: Amazon S3.
Group by Usage Type to see a detailed breakdown of costs. Common S3 usage types include those related to timed storage per byte-hour for different storage classes (e.g., USE1-TimedStorage-ByteHrs, USE1-TimedStorage-SIA-ByteHrs), request tiers (e.g., USE1-Requests-Tier1, USE1-Requests-Tier2), and data transfer (e.g., DataTransfer-Out-Bytes, DataTransfer-Regional-Bytes). The exact naming can vary slightly by region, but the structure is consistent.
Further granularity can be achieved by grouping by Storage Class if this information is embedded in the Usage Type description or if custom tags are used to denote the intended storage class at the bucket or prefix level.
To isolate S3 costs for specific initiatives, filter by relevant tags such as Tag: project-name or Tag: data-pipeline-id.
Data transfer costs associated with Amazon S3 can often be a significant and sometimes overlooked component of overall expenditure, particularly for data pipelines that move large datasets across different AWS regions or out to the public internet. Cost Explorer can effectively highlight these expenses. By filtering for Service: Amazon S3 and then examining usage types related to data transfer (e.g., DataTransfer-Out-Bytes, DataTransfer-Regional-Bytes, or broader groups like EC2-ELB-DataTransfer-Out if S3 is accessed via services within that group), data engineers can identify and quantify these costs. This visibility prompts a necessary investigation into data movement patterns and can lead to the implementation of optimization strategies, such as utilizing VPC endpoints for private access to S3 (reducing NAT gateway charges), choosing appropriate AWS regions to co-locate compute and storage, or compressing data before transfer.
4.2. AWS Glue: DPU-Hours, Crawlers, and Data Catalog Costs
AWS Glue is a serverless ETL service, and its costs are primarily driven by the consumption of Data Processing Units (DPUs) for ETL jobs, billed in DPU-hours. Other cost factors include the type of job (Apache Spark, Spark Streaming, Python Shell, Ray), the use of Flexible Execution for Spark jobs (which has a different DPU-hour rate), runtime of Interactive Sessions and Development Endpoints, crawler runtime, and Data Catalog costs (storage for metadata and requests made to the catalog).
To analyze AWS Glue costs in Cost Explorer:
Apply a filter for Service: Glue (or AWS Glue).
Group by Usage Type to differentiate cost components. Common usage types include Region-ETL-DPU-Hour (for standard ETL jobs), Region-Flex-DPU-Hour (for flexible execution jobs), Region-Crawler-Hour, Region-Catalog-Storage, and Region-Catalog-Request.
Filter by tags such as Tag: etl-job-name or Tag: data-source to track the costs associated with specific ETL processes or data sources.
AWS Glue jobs, particularly Spark jobs, are billed per second with a minimum charge duration, typically 1 minute. If a data pipeline involves numerous very short-running Glue jobs (e.g., jobs that complete in less than this minimum), a significant portion of the billed time can be attributed to this minimum charge overhead, rather than actual processing. Cost Explorer can provide indirect indications of this scenario. By filtering for AWS Glue costs and comparing the total DPU-hours reported in Cost Explorer against the number of job runs (which can be obtained from the AWS Glue console or CloudWatch metrics), a potential inefficiency might be revealed. If the total DPU-hour cost appears disproportionately high relative to the sheer number of jobs and their estimated actual (sub-minute) processing times, it could suggest that many jobs are consistently falling into the minimum billing duration. Such an observation would prompt data engineers to investigate strategies like consolidating smaller jobs into larger ones, optimizing job startup times, or exploring alternative execution patterns to mitigate the impact of these minimum billing increments.
4.3. Amazon EMR: Instance Hours, Software, and Storage Costs
Amazon EMR costs are multifaceted, primarily driven by the underlying Amazon EC2 instance-hours (billed per second with a one-minute minimum), an EMR service fee applied per instance-hour, costs for Amazon EBS storage attached to instances, and potentially Amazon S3 storage if EMRFS is used as the primary data store. The specific EMR deployment model—on EC2, on Amazon EKS, or EMR Serverless—also influences the pricing structure.
To analyze Amazon EMR costs in Cost Explorer:
Apply a filter for Service: Elastic MapReduce.
Group by Instance Type to understand the cost contribution of different EMR node types (e.g., m5.xlarge, r5.2xlarge).
Group by Usage Type to differentiate the EC2 instance costs from the EMR service fees. For example, you might see usage types like USE1-BoxUsage:m5.xlarge (representing the EC2 cost) and USE1-EMR:m5.xlarge (representing the EMR surcharge for that instance type).
Filter by tags such as Tag: emr-cluster-id, Tag: project-name, or Tag: pipeline-step to allocate costs to specific clusters or data processing stages.
A common and effective optimization strategy for Amazon EMR is the utilization of EC2 Spot Instances for task nodes, which can provide significant cost savings compared to On-Demand prices. Cost Explorer is instrumental in verifying the financial benefits of this strategy. By filtering costs to your specific EMR cluster tags and then grouping the results by Purchase Option (which distinguishes between On-Demand, Spot, and Reserved Instances), you can clearly visualize the cost breakdown. This view allows data engineers to quantify the savings achieved through their Spot Instance strategy, monitor the ratio of On-Demand versus Spot costs for their clusters, and identify if, for example, an excessive number of core nodes (often run as On-Demand or covered by RIs for stability) are provisioned relative to task nodes (which are ideal candidates for Spot Instances).
4.4. Amazon Kinesis: Shard Hours, PUT Payload Units, and Data Retention
Amazon Kinesis services, particularly Kinesis Data Streams, incur costs based on several dimensions: shard hours (each shard provides a certain level of throughput capacity), PUT Payload Units (data is billed in 25KB chunks for ingestion), extended or long-term data retention options, and the use of Enhanced Fan-Out consumers which have their own pricing.
To analyze Amazon Kinesis costs in Cost Explorer:
Apply a filter for Service: Amazon Kinesis. Depending on the specific Kinesis service used (Data Streams, Firehose, Data Analytics), the service name in Cost Explorer might vary (e.g., Amazon Kinesis Data Streams, Amazon Kinesis Firehose).
Group by Usage Type to see the cost breakdown. Common usage types include those related to shard hours (e.g., Region-ShardHour), PUT payload units (e.g., Region-PayloadUnits-Bytes or similar, reflecting data ingestion volume), extended data retention (e.g., Region-ExtendedRetention-Bytes), and enhanced fan-out (e.g., Region-EFO-Consumer-ShardHour).
Filter by tags such as Tag: stream-name or Tag: application-id to attribute costs to specific data streams or the applications consuming/producing data.
For Kinesis Data Streams, achieving an optimal balance in shard provisioning is key to both performance and cost-efficiency. Under-provisioning shards can lead to throttled records and potential data loss, while over-provisioning results in unnecessary expenditure on unused capacity. While Cost Explorer effectively displays the cost associated with shard hours, it does not directly indicate whether these shards are being optimally utilized. Therefore, the cost data from Cost Explorer must be correlated with operational metrics from Amazon CloudWatch for Kinesis, such as IncomingBytes, PutRecords.Success, ReadProvisionedThroughputExceeded, and WriteProvisionedThroughputExceeded. A rising cost for shard hours, as observed in Cost Explorer, should trigger a thorough review of these CloudWatch metrics. For instance, if Cost Explorer shows stable or increasing shard hour costs, but CloudWatch simultaneously indicates high ReadProvisionedThroughputExceeded or WriteProvisionedThroughputExceeded events, it suggests that the stream is under-provisioned despite the ongoing cost, and more shards (consequently leading to higher costs) might be necessary to meet performance demands. Conversely, consistently low throughput metrics in CloudWatch coupled with high shard costs in Cost Explorer would point towards over-provisioning, signaling an opportunity for cost reduction by decreasing the shard count. Strategic cost optimization for Kinesis thus requires a careful balancing of financial data from Cost Explorer with these critical operational performance metrics.
4.5. AWS Lambda: Requests, Duration, and Memory Allocation
AWS Lambda, a serverless compute service, has a pricing model based on several factors: the total number of requests for your functions, the execution duration of each request (rounded up to the nearest millisecond), and the amount of memory allocated to the function. Additional cost considerations include the underlying CPU architecture (x86 or Arm, with Arm typically offering better price-performance), charges for provisioned concurrency (if used), and costs associated with AWS Step Functions if Lambda functions are orchestrated as part of a larger workflow.
To analyze AWS Lambda costs in Cost Explorer:
Apply a filter for Service: AWS Lambda.
Group by Usage Type to understand the cost composition. Common usage types include those related to requests (e.g., Region-Requests), compute duration typically measured in GB-seconds (e.g., Region-Duration-GB-Hours or Region-Lambda-GB-Second), and provisioned concurrency (e.g., Region-Provisioned-Concurrency).
Filter by tags such as Tag: function-name or Tag: microservice-id to track costs for specific Lambda functions or the microservices they support.
The cost of AWS Lambda functions used in data pipelines (e.g., for processing S3 events, transforming Kinesis records, or orchestrating ETL steps) is a dynamic interplay between memory allocation, execution duration, and request volume. Optimizing one of these parameters can influence the others; for instance, increasing the allocated memory for a function might decrease its execution duration, potentially leading to lower overall costs if the reduction in duration outweighs the increased per-millisecond cost of higher memory. Cost Explorer primarily shows the aggregated impact, often in terms of Duration-GB-Hours or similar metrics. To truly optimize Lambda functions, data engineers should use Cost Explorer to monitor the overall cost trend of a specific function (identified via tags). This financial oversight should then be combined with tools like AWS Lambda Power Tuning (which helps find the optimal memory configuration for a function by running it with various settings and measuring performance and cost) and detailed analysis of execution logs in Amazon CloudWatch Logs Insights. This allows for fine-tuning memory allocation to achieve the best price/performance ratio, with Cost Explorer subsequently used to verify that the implemented changes have indeed resulted in the anticipated cost reductions.
4.6. Amazon Redshift: Node Types, Storage, and Data Transfer
Amazon Redshift, a fully managed data warehousing service, has costs driven by several components depending on the deployment model. For provisioned clusters, costs are determined by the type and number of compute nodes, associated storage (including backup storage), and data transfer. For Redshift Serverless, costs are based on Redshift Processing Unit (RPU)-hours consumed and storage used. Additional cost factors can include Concurrency Scaling (which adds temporary cluster capacity during peak query loads) and Redshift Spectrum queries (which allow querying data directly in Amazon S3). For RA3 node types, managed storage is a distinct cost component.
To analyze Amazon Redshift costs in Cost Explorer:
Apply a filter for Service: Amazon Redshift.
Group by Instance Type (for provisioned clusters like dc2.large, ra3.4xlarge) or by the relevant Usage Type for Redshift Serverless (e.g., Region-RPU-Usage, Region-Redshift-Storage-Serverless).
Group by Usage Type to distinguish between compute costs, storage costs, and data transfer costs (e.g., Region-HeavyUsage:dc2.large for compute, Region-Redshift-Storage for provisioned storage, Region-Redshift-DataTransfer-Out for data transfer).
Filter by tags such as Tag: cluster-name or Tag: data-warehouse-project to isolate costs for specific Redshift deployments or use cases.
A common source of unnecessary expenditure in provisioned Amazon Redshift clusters is the underutilization of compute nodes, particularly during periods of low query activity. Cost Explorer can effectively reveal the ongoing cost of these nodes. When this financial data is combined with Redshift performance metrics—such as CPU utilization, query queue lengths, and database connection counts, available through the Redshift console or Amazon CloudWatch—it can highlight significant opportunities for optimization. For example, if Cost Explorer shows consistently high costs for a Redshift cluster, while performance metrics indicate low CPU utilization and no query queuing for extended periods (such as nights or weekends), this is a clear indicator of underutilization. Such insights, derived from the synergy of Cost Explorer's financial data and operational metrics, can drive strategic decisions to:
Implement automated pause and resume schedules for the cluster during known idle times (note: Redshift suspends On-Demand billing when a cluster is paused, but backup storage costs still apply ).
Downsize the cluster by reducing the number of nodes or selecting smaller, more appropriately sized node types.
Evaluate a migration to Redshift Serverless, which automatically scales compute capacity up or down (including scaling to zero when inactive) based on workload demand, making it a potentially more cost-effective solution for spiky or intermittent workloads. Cost Explorer provides the essential financial data to build a business case for such architectural changes.
The following table serves as a quick reference for breaking down costs of key data engineering services using Cost Explorer:
Table: Data Engineering Service Cost Breakdown in Cost Explorer
5. Advanced Cost Management: Beyond Basic Cost Explorer Views
While AWS Cost Explorer provides powerful built-in capabilities, advanced cost management for data engineering often requires deeper granularity, custom calculations, and integration with broader FinOps practices. This involves robust cost allocation strategies and, in many cases, leveraging the detailed data available in AWS Cost and Usage Reports (CUR).
5.1. Effective Cost Allocation Strategies
Accurate cost allocation is fundamental to understanding the true cost of data engineering projects, pipelines, and services, enabling showback, chargeback, and informed decision-making.
5.1.1. Implementing a Robust Tagging Policy for Data Engineering
Cost allocation tags are metadata labels, defined as key-value pairs, that can be assigned to AWS resources to help organize, track, and allocate costs. For data engineering workloads, user-defined tags are particularly crucial as they allow costs to be attributed to specific data pipelines, projects, teams, development/test/production environments, or distinct data domains.
Best practices for implementing a robust tagging policy include :
Develop a Consistent Nomenclature: Establish standardized and consistent naming conventions for tag keys and values (e.g., project:apollo-data-lake, pipeline:customer-ingestion-v2, environment:production, data-sensitivity:confidential). This ensures uniformity and simplifies filtering and reporting.
Enforce Tagging at Resource Creation: Tags are not applied retroactively; they only track usage and costs from the moment they are activated on a resource. Therefore, it is critical to integrate tagging into resource provisioning workflows, whether manual or automated (e.g., via Infrastructure as Code tools like CloudFormation or Terraform).
Regularly Audit Tag Coverage and Correctness: Periodically review resources to ensure they are tagged according to policy and that tag values are accurate. Identify and remediate any untagged or incorrectly tagged resources.
Utilize AWS Tag Editor: For applying or modifying tags on multiple existing resources simultaneously, the AWS Tag Editor provides a centralized interface.
Activate Tags for Cost Allocation: For tags to be usable for filtering and grouping within AWS Cost Explorer and to appear in the AWS Cost and Usage Reports, they must be activated as "cost allocation tags" in the AWS Billing and Cost Management console. This activation process can take up to 24 hours for the tags to become fully operational in cost management tools.
For data engineering, the tagging strategy should extend beyond generic organizational tags like "environment" or "cost-center." Consideration should be given to tags that reflect the data lifecycle or specific processing stages, such as data-stage:raw, data-stage:transformed, data-stage:curated, or tags that identify the business units or applications consuming the data products. This level of detailed, data-centric tagging enables more sophisticated cost attribution models. For example, it becomes possible to differentiate the "cost to maintain the raw data lake" from the "cost to serve curated datasets to the business intelligence platform," or to track the cost of a specific data pipeline (data-pipeline-id:<ID>), data source (data-source:<source_system>), or data product (data-product:<product_name>). While implementing such a granular strategy requires more initial effort and ongoing discipline, it unlocks very precise cost allocation, facilitating accurate showback or chargeback mechanisms for data assets and services, and directly linking data infrastructure expenditures to tangible business value.
5.1.2. Utilizing AWS Cost Categories for Business-Specific Grouping
AWS Cost Categories offer a powerful mechanism to group AWS costs based on user-defined rules, which can be applied to dimensions such as accounts, tags, services, or even other existing Cost Categories. This feature allows organizations to create an additional, custom dimension within Cost Explorer for filtering and grouping costs, effectively aligning AWS expenditures with internal business structures—such as "Data Platform Operations Team," "Marketing Analytics Initiatives," or "Shared Data Services"—often without the need for overly complex or hierarchical tagging schemes. The rules for Cost Categories can be configured to categorize costs originating from specific AWS accounts or resources bearing particular tags into a defined, business-relevant category.
Cost Categories can significantly simplify cost reporting for data engineering teams, especially when their operations span multiple AWS accounts or involve resources with intricate, overlapping tagging structures. For instance, a "Shared Data Infrastructure" Cost Category could be defined to aggregate costs from a central data lake account, plus specifically tagged Amazon EMR clusters running in various application-specific accounts that consume data from these shared services. This provides a consolidated financial view that might be difficult or cumbersome to achieve using tag-based filtering alone, particularly if tags are not perfectly consistent across all relevant accounts and resources. Cost Categories thus offer a layer of abstraction that maps technical resource costs to more easily understandable business contexts.
5.2. AWS Cost and Usage Reports (CUR) for Deeper Granularity
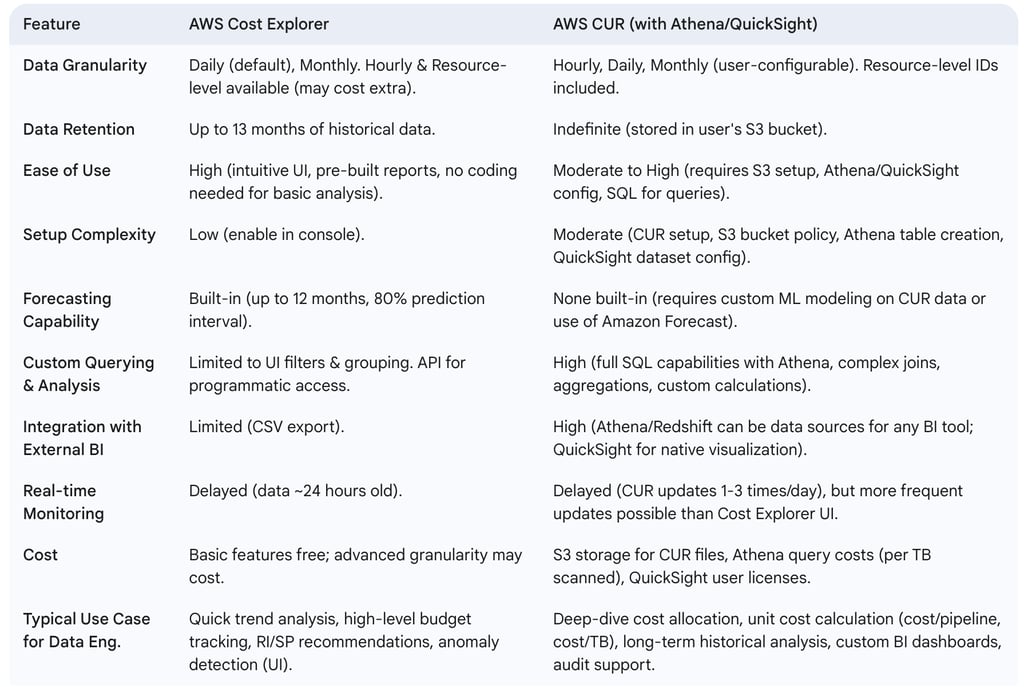
While Cost Explorer offers a user-friendly interface for most cost analysis needs, the AWS Cost and Usage Report (CUR) provides the most detailed level of billing information available.
5.2.1. When to Use CUR over Cost Explorer for Data Engineering
The AWS Cost and Usage Report (CUR) is the definitive source for comprehensive and granular billing data, offering details down to individual resource IDs and, if configured, hourly granularity. Data engineers should consider using CUR when their analytical requirements exceed the capabilities of Cost Explorer. Key scenarios include:
Extended Historical Analysis: Cost Explorer typically retains data for 12-13 months. CUR files, however, are delivered to an Amazon S3 bucket owned by the user and can be stored indefinitely, enabling long-term historical cost analysis beyond Cost Explorer's horizon.
Resource-Level Detail Beyond Limits: Cost Explorer may only display the top 5,000 most costly resources per service in its interface. For environments with a vast number of resources, CUR provides line-item details for every single resource.
Essential Hourly Granularity: For very fine-grained analysis of short-lived data processing jobs or transient workloads, hourly granularity (available in CUR) is often essential. While Cost Explorer can offer hourly data, it may come with additional costs and is primarily for visualization, not bulk export of all hourly line items.
Integration with External BI Systems: When AWS cost data needs to be integrated with external business intelligence platforms, data warehouses, or custom financial reporting systems for combined analysis, CUR's downloadable format (CSV, Parquet) is ideal.
Custom, Complex Cost Calculations: If sophisticated cost allocation models, unit cost calculations (e.g., cost per specific API call type, cost per gigabyte processed by a particular Lambda function), or chargeback mechanisms requiring complex logic are needed, the raw data in CUR, queryable via SQL-like tools, is necessary.
In contrast, AWS Cost Explorer is generally more suitable for quick, visual analysis, identifying broad cost trends, leveraging built-in forecasting, and accessing RI/SP purchase recommendations without requiring deep technical setup or data engineering effort.
For data engineering teams, CUR becomes particularly indispensable when striving to implement true "unit cost" metrics, such as the precise cost per execution of a data pipeline or the cost per terabyte of data ingested and transformed by a specific process. While Cost Explorer, augmented with tags, can provide approximations, CUR—with its resource-level detail and hourly data—allows for much more accurate calculations. This is especially true when CUR data is combined with operational metadata, such as pipeline execution logs that record start and end times, specific resources utilized during a run, and data volume records. This level of detailed, custom metric calculation is typically beyond the direct capabilities of Cost Explorer and represents a primary use case for leveraging CUR.
5.2.2. Analyzing CUR with Amazon Athena for Custom Queries
CUR files, which are delivered to and stored in an Amazon S3 bucket (often in Apache Parquet format for optimized query performance and reduced storage ), can be directly and efficiently queried using Amazon Athena. Athena is a serverless, interactive query service that allows users to analyze data in S3 using standard SQL, without the need to provision or manage any underlying infrastructure. This integration empowers data engineers to perform complex filtering, join CUR data with other metadata tables (e.g., a table mapping resource IDs to application names or business owners), and execute sophisticated aggregations that are not feasible within the Cost Explorer user interface.
The setup process typically involves creating an Athena table that defines the schema corresponding to the CUR data structure in the S3 bucket. AWS often provides CloudFormation templates or detailed setup guides to streamline this table creation process. Once the table is defined, users can run SQL queries to extract specific cost insights, such as the total cost incurred by resources bearing particular tags within a custom date range, or the sum of data transfer costs between specific Availability Zones for components of a distributed data pipeline.
A critical consideration for efficient and cost-effective analysis of CUR data with Athena is the partitioning of the CUR data in Amazon S3. CUR files can grow to be very large, especially when hourly granularity is enabled. Athena's pricing model is based on the amount of data scanned per query. Querying an entire multi-terabyte CUR dataset to retrieve a small subset of information would be both slow and expensive. By partitioning the CUR data in S3—typically by dimensions like year, month, and day (e.g., s3://your-cur-bucket/cur_data/year=YYYY/month=MM/day=DD/)—and defining the Athena table over these partitions, queries can be made significantly more efficient. When a query includes predicates on these partition keys in the WHERE clause (e.g., WHERE year='2023' AND month='10'), Athena's query planner can prune the search space, scanning only the data within the specified partitions. This dramatically improves query performance and reduces costs. Therefore, ensuring that CUR delivery is structured to support efficient partitioning is an essential best practice for leveraging Athena for CUR analysis.
5.2.3. Visualizing CUR Data with Amazon QuickSight
Amazon QuickSight, a scalable, serverless, embeddable, machine learning-powered business intelligence service, can be used to create custom dashboards and visualizations from CUR data. QuickSight can connect to Amazon Athena (which, in turn, queries the CUR data stored in S3) or, in some configurations, connect directly to the S3 CUR data itself, often facilitated by a manifest file that describes the dataset. This provides more advanced and flexible visualization options and dashboarding capabilities compared to those natively available within AWS Cost Explorer.
Using QuickSight, data engineering teams can build tailored views of their cost data, suitable for different stakeholders or analytical purposes. This might involve combining CUR data with other operational or business datasets to provide richer context. Examples of such dashboards could include visualizations showing cost per tenant in a multi-tenant data application, a detailed geographical breakdown of data transfer costs by route, or the trending of custom unit costs (like cost per pipeline run or cost per TB processed) that were initially calculated using Athena queries on the CUR data.
While QuickSight offers powerful visualization tools, the data preparation stage—especially if it involves complex calculations, joins with external datasets, or significant data transformations—is often best performed in Amazon Athena beforehand. QuickSight can then connect to and consume these pre-processed, aggregated, and refined datasets from Athena. This architectural pattern typically leads to more responsive dashboards and simpler dataset management within QuickSight itself. This approach leverages the distinct strengths of each service: Athena for robust, scalable SQL-based data wrangling and complex computations on large raw CUR datasets stored in S3, and QuickSight for the interactive visualization and exploration of the resulting, more manageable, and insight-rich data.
5.2.4. Tracking Cost-per-Pipeline and Cost-per-Terabyte-Processed
Achieving highly granular metrics such as "cost-per-pipeline" or "cost-per-terabyte-processed" typically necessitates the detailed data from AWS Cost and Usage Reports (CUR) combined with a meticulously implemented resource tagging strategy.
Cost-per-Pipeline: To calculate this, all AWS resources that constitute a specific data pipeline must be consistently tagged with a unique pipeline identifier (e.g., pipeline-id:customer_etl_daily). Using Amazon Athena, the CUR data can then be queried, filtering by this specific pipeline tag, to sum all associated costs for particular execution windows. Accurately defining these execution windows often requires correlating the CUR data with operational logs from the pipeline orchestration tool (e.g., Apache Airflow, AWS Step Functions) that record the start and end times of each pipeline run.
Cost-per-Terabyte-Processed: Building on the cost-per-pipeline calculation, tracking cost-per-terabyte-processed requires capturing additional operational metadata: the volume of data processed by each pipeline run (e.g., terabytes ingested, terabytes transformed, terabytes written). This data volume information, typically sourced from pipeline logs, application metrics, or data store metadata, must then be joined with the cost data derived from CUR (linked by the pipeline ID and the specific execution timestamp) within an analytical environment like Athena. The resulting calculation (total cost for a pipeline run / terabytes processed in that run) yields the desired unit cost metric.
These custom-calculated metrics can subsequently be ingested into Amazon QuickSight or other business intelligence tools for ongoing monitoring, trend analysis, and dashboard reporting.
The accuracy and meaningfulness of a "cost-per-TB-processed" metric are heavily dependent on a clear and consistent definition of what "TB processed" signifies for each stage of a data pipeline. For instance, does it refer to the size of the input data, the volume of output data, or the amount of data scanned during processing? This metric requires a precise business definition and a consistent technical implementation for its measurement to ensure that the resulting tracking and comparisons are valid and actionable. AWS Cost Explorer alone cannot provide this level of custom unit cost calculation; it is an advanced analytical task that inherently involves the integration of CUR data with external operational data sources.
5.3. Integrating with AWS Budgets for Proactive Control
AWS Budgets is a service that allows users to set custom cost or usage budgets for their AWS resources and receive alerts when these predefined thresholds are breached or are forecasted to be breached. This service integrates closely with the data available in Cost Explorer. Budgets can be configured with a high degree of specificity, targeting particular AWS services, individual linked accounts within an AWS Organization, resources identified by specific cost allocation tags, or defined AWS Cost Categories. This granularity makes AWS Budgets highly effective for managing and controlling data engineering expenditures.
When a budget threshold is crossed or projected to be exceeded, AWS Budgets can trigger alerts, which can be delivered as notifications via Amazon SNS (Simple Notification Service) or email. Beyond simple notifications, AWS Budgets also supports "Budget Actions," which can initiate automated responses to budget events.
For data engineering teams, establishing budgets at the level of individual data pipelines or specific projects—typically achieved by leveraging cost allocation tags—is generally more impactful than setting broader, service-level budgets. For example, a general budget for "AWS Glue" might be too coarse to provide actionable insights if multiple teams and pipelines share the service. In contrast, a budget specifically defined for resources tagged with pipeline-id:critical-etl-001 offers much more targeted oversight and accountability. If this pipeline-specific budget is at risk, the alert is directly relevant to the team responsible for that pipeline. Budget Actions could be configured, for instance, to send a notification to a dedicated Slack channel for the data pipeline team. In more advanced (and cautiously implemented) scenarios, a Budget Action could even trigger an AWS Lambda function to take a corrective measure, such as scaling down or stopping a non-production development or test pipeline that is significantly overspending its allocated budget. This promotes granular accountability: if the "customer-churn-prediction-pipeline" budget is breached, the data science team responsible for that pipeline is directly notified and can investigate, rather than a generic alert being routed to a central cloud financial operations team.
The following table compares AWS Cost Explorer and AWS CUR for data engineering analysis:
Table: Comparison: AWS Cost Explorer vs. AWS CUR for Data Engineering Analysis
The following table provides a blueprint for a tagging strategy for data engineering cost allocation:
Table: Tagging Strategy Blueprint for Data Engineering Cost Allocation
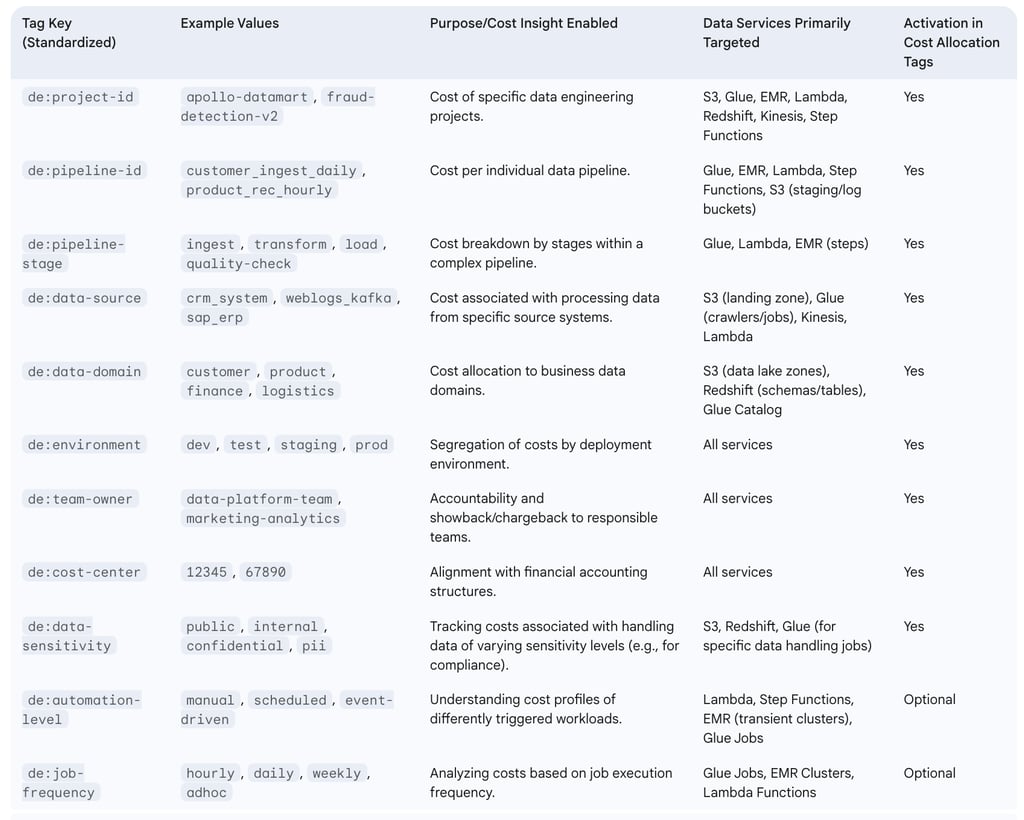
Note: The de: prefix is an example to namespace data engineering-specific tags and avoid conflicts with other organizational tags.
6. Best Practices and Limitations
Effectively leveraging AWS Cost Explorer for data engineering requires adherence to best practices and an understanding of its inherent limitations.
6.1. Best Practices for Using AWS Cost Explorer in Data Engineering
To maximize the value derived from AWS Cost Explorer for managing data engineering costs, consider the following best practices:
Regular Reviews: Establish a cadence for reviewing Cost Explorer dashboards and reports. Tactical reviews of daily or weekly trends can help catch immediate issues, while monthly or quarterly reviews are suitable for strategic analysis and budget alignment.
Comprehensive Tagging: Implement and enforce a thorough and consistent tagging strategy for all data engineering resources. Tags for projects, pipelines, environments, and ownership are crucial for granular cost allocation. Ensure these tags are activated for cost allocation in the Billing console.
Strategic Filtering and Grouping: Actively use Cost Explorer's filtering and grouping capabilities to isolate and analyze costs by specific data projects, individual pipelines, AWS services, or deployment environments.
Informed Forecasting: Utilize Cost Explorer's forecasting features for budget planning and anticipating future spend. However, be mindful of its limitations, especially for new initiatives or highly volatile workloads where historical data is sparse or not representative.
Proactive Budgeting with AWS Budgets: Set up AWS Budgets that are linked to Cost Explorer data. Create budgets for specific data projects, critical pipelines (using tags), or key data services to receive proactive alerts when spending thresholds are approached or exceeded.
Holistic Analysis: Combine insights from Cost Explorer with operational metrics obtained from Amazon CloudWatch, application logs, and pipeline monitoring tools. This provides a more complete picture, correlating cost trends with performance, utilization, and efficiency of data workloads.
Team Enablement and Cost Awareness: Educate data engineering teams on how to effectively use Cost Explorer and interpret its data. This fosters a culture of cost awareness and empowers engineers to make cost-conscious decisions.
Automation via API: For advanced use cases, leverage the Cost Explorer API to automate the retrieval of cost and usage data, enabling integration with internal financial systems, custom dashboarding solutions, or automated reporting workflows.
A particularly effective best practice is to establish a regular "Cost Optimization Review" meeting or process specifically for data engineering teams. During these sessions, relevant Cost Explorer reports (both standard and custom-tailored) should be discussed, any identified anomalies thoroughly investigated, and potential optimization opportunities prioritized and assigned for action. This operationalizes cost management, embedding it directly within the engineering workflow and transforming it from a passive reporting activity into an active, ongoing practice of financial stewardship.
6.2. Understanding the Limitations of AWS Cost Explorer
While AWS Cost Explorer is a valuable tool, it is important to be aware of its limitations, especially in the context of complex data engineering workloads:
Data Latency: Cost Explorer data is not real-time; it is typically updated once every 24 hours. This delay can hinder the immediate detection of rapidly escalating costs from runaway jobs or misconfigurations.
Limited Historical Data: The platform generally provides access to only the last 12-13 months of historical cost data. For longer-term trend analysis or multi-year comparisons, AWS Cost and Usage Reports (CUR) are necessary.
Granularity Constraints: While Cost Explorer offers good granularity, it may not display all resource-level details if the number of individual resources within a service is extremely high (e.g., it might show the top 5,000 most costly resources per service ). Furthermore, enabling hourly and resource-level granularity can incur additional charges.
Forecasting Inaccuracies for New or Volatile Workloads: Forecasts are based on historical data. Consequently, they are less accurate for new services, recently launched projects, or workloads with highly erratic and unpredictable usage patterns. The prediction interval is fixed (typically 80%), and the tool cannot generate multiple concurrent forecasts for different scenarios.
Limited Customization in Querying: While users can save custom reports, the complexity of queries and the extent of data transformation possible within the Cost Explorer interface are significantly more limited compared to the capabilities offered by analyzing CUR data with tools like Amazon Athena and SQL.
Ambiguity in Certain Cost Categories: Some aggregated cost categories, such as "EC2-Other," can be opaque and difficult to break down into their constituent components using Cost Explorer alone, making precise cost attribution challenging.
Primarily a Visibility Tool: Cost Explorer excels at providing visibility into costs and usage. While it offers RI and Savings Plan purchase recommendations and links to services like AWS Trusted Advisor and AWS Compute Optimizer, it does not provide prescriptive, context-aware optimization advice for all complex data engineering scenarios directly within its interface.
Heavy Reliance on Tagging: The effectiveness of Cost Explorer for granular cost allocation and attribution is heavily dependent on a comprehensive, accurate, and consistently applied tagging strategy. Gaps or inconsistencies in tagging will directly limit the insights achievable.
The limitation regarding "visibility without direct deep-dive recommendations" for intricate data pipeline logic is particularly relevant. Cost Explorer serves as an excellent indicator and aggregator of costs. It can highlight that a specific tagged Glue job is expensive and might break down this cost by DPU-hours. However, it will not analyze the Python or Spark code within that Glue job to suggest specific algorithmic optimizations, more efficient data partitioning strategies within the job's logic, or the use of more performant libraries. These are data engineering-specific optimizations that require domain expertise and often involve code-level analysis and performance profiling. Cost Explorer provides the crucial financial signal that an optimization is warranted; the data engineer must then apply their specialized skills and potentially other tools (like profilers, debuggers, and detailed logs) to diagnose and implement the necessary technical improvements.
6.3. Fostering a Cost-Aware Culture in Data Teams
Technology alone is insufficient for sustained cost optimization; a culture of cost awareness and accountability within data engineering teams is paramount.
Empowerment through Access and Training: Provide data engineers with appropriate access to AWS Cost Explorer and offer training on its features and how to interpret the data presented.
Cost as a Design Tenet: Integrate cost considerations into the architectural design and development processes for new data solutions. Encourage thinking about cost implications from the outset.
Transparent Reporting: Regularly share tailored cost reports and dashboards with data teams, highlighting spending trends, the impact of optimization efforts, and areas that require attention.
Accountability through Attribution: Implement clear cost attribution by assigning costs to specific teams, projects, or data pipelines using a robust tagging strategy and AWS Cost Categories. This fosters a sense of ownership.
Recognize Optimization Successes: Acknowledge and celebrate successful cost optimization initiatives to reinforce positive behaviors and share learnings across teams.
Integrate Cost Discussions: Make cost reviews a regular agenda item in team meetings, sprint reviews, and architectural discussions.
Empowering engineers with direct access to cost data via tools like Cost Explorer, and fostering a sense of accountability for the costs their services and pipelines generate (often facilitated by tagging and showback mechanisms ), can lead to a "FinOps shift-left" culture. When engineers inherently understand the cost implications of their design choices, resource configurations, and daily operational practices, they are significantly more likely to build and maintain cost-efficient data solutions proactively. This approach is generally more effective and sustainable than relying solely on a central FinOps team to identify and implement savings retrospectively. For instance, when an engineer can directly observe in Cost Explorer that an inefficiently written Spark query is causing a daily spike in EMR costs for their pipeline, they are intrinsically motivated to optimize that query, thereby addressing the cost issue at its source. This embeds cost optimization within the development lifecycle, leading to more sustainable and efficient cloud usage.
The following table provides a quick reference for data engineers on Cost Explorer best practices and limitations:
Table: Quick Reference: Cost Explorer Best Practices vs. Limitations for Data Engineers
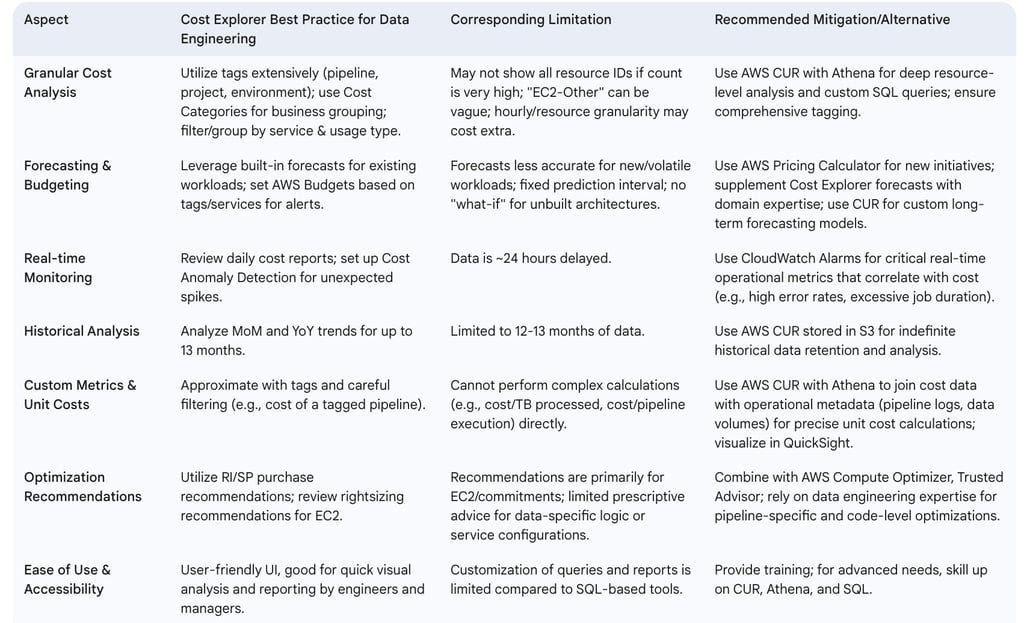
7. Conclusion and Recommendations
AWS Cost Explorer is an indispensable tool for data engineering teams aiming to achieve financial transparency and optimize their cloud expenditures. Its capabilities in visualization, filtering, grouping, and forecasting provide a solid foundation for both tactical operational control and strategic long-term planning.
Key Takeaways:
Tactical Management: Cost Explorer empowers data engineers to monitor daily and monthly spending, identify cost drivers at the service and resource (via tags) level, and investigate anomalies. Default reports offer quick insights, while custom reports with granular filtering are essential for dissecting costs of specific data pipelines and services like S3, Glue, EMR, Kinesis, Lambda, and Redshift.
Strategic Planning: The tool supports strategic decision-making by providing RI/SP utilization data and purchase recommendations. Its forecasting features, while having limitations for entirely new initiatives, are valuable for budgeting the scaling of existing platforms. Cost Explorer data can also inform architectural choices by allowing comparisons of actual costs for different implemented patterns (e.g., serverless vs. cluster-based processing) when resources are appropriately tagged.
Cost Allocation is Paramount: The effectiveness of Cost Explorer for granular data engineering cost analysis hinges on a robust and consistently applied tagging strategy. Augmenting tags with AWS Cost Categories can further align cloud costs with internal business structures.
Beyond Cost Explorer - The Role of CUR: For requirements exceeding Cost Explorer's capabilities—such as indefinite historical data retention, highly granular resource-level analysis for vast numbers of resources, complex custom unit cost calculations (e.g., cost-per-pipeline-execution, cost-per-TB-processed), and deep integration with external BI systems—AWS Cost and Usage Reports (CUR), analyzed with Amazon Athena and visualized with Amazon QuickSight, become essential.
Holistic Approach: Cost data from Cost Explorer or CUR should always be correlated with operational metrics (performance, utilization, error rates) from services like CloudWatch to gain a complete understanding of cost-efficiency. A cost spike, for example, needs to be understood in the context of whether usage or an inefficiency drove it.
Cultural Integration: Fostering a cost-aware culture by providing data engineering teams with access to cost data, training, and accountability is crucial for sustained cost optimization.
Recommendations for Data Engineering Teams:
Enable and Standardize Cost Explorer Usage: Ensure Cost Explorer is enabled for all relevant accounts. Establish standardized practices for its use within the data engineering team, including regular review cadences.
Develop and Enforce a Data-Centric Tagging Policy: Implement a comprehensive tagging strategy specifically designed for data engineering workloads. Include tags for project-id, pipeline-id, environment, team-owner, data-domain, and data-stage. Activate these tags for cost allocation.
Utilize Custom Reports and Saved Views: Move beyond default reports. Create and save custom Cost Explorer reports tailored to track key data engineering initiatives, specific data pipelines, and critical service expenditures.
Integrate with AWS Budgets and Anomaly Detection: Set up AWS Budgets based on tagged data engineering projects or pipelines for proactive alerts. Configure AWS Cost Anomaly Detection monitors scoped to key data services or tags to quickly identify unexpected spend.
Complement with CUR for Advanced Needs: For deep-dive analytics, unit costing, and long-term historical analysis, establish a pipeline for ingesting and analyzing CUR data using Amazon S3, Athena, and QuickSight.
Correlate Cost with Operational Data: Do not analyze cost data in isolation. Always cross-reference Cost Explorer insights with performance metrics from CloudWatch and application logs to understand the "why" behind cost changes.
Invest in Training and Foster Accountability: Train data engineers on cost management principles and tools. Make cost visibility and accountability integral parts of the data engineering lifecycle, from design to operation.
Iterate and Optimize Continuously: Treat cost management as an ongoing process. Regularly review cost trends, evaluate the effectiveness of optimization measures, and refine architectural and operational practices to maintain cost efficiency as the data platform evolves.
By strategically employing AWS Cost Explorer and integrating it into their operational and planning workflows, data engineering teams can effectively manage their cloud spend, optimize resource utilization, and ensure that their data infrastructure delivers maximum value to the business.