Elasticsearch: Tactical and Strategic Guide to Cloud Implementation
This report provides a comprehensive guide to leveraging Elasticsearch in the cloud, covering foundational concepts, deployment models, data ingestion and management strategies, performance optimization techniques, security best practices, cost control measures, and advanced use cases.


Elasticsearch has emerged as a powerful, distributed search and analytics engine, particularly well-suited for the dynamic and scalable nature of cloud environments. For data engineers, mastering its implementation involves both tactical proficiency in configuration and management, and strategic understanding of architectural choices and their long-term implications. This report provides a comprehensive guide to leveraging Elasticsearch in the cloud, covering foundational concepts, deployment models, data ingestion and management strategies, performance optimization techniques, security best practices, cost control measures, and advanced use cases.
Strategically, the choice of cloud deployment model—ranging from fully managed Elastic Cloud Serverless and Elastic Cloud Hosted options to self-managed IaaS deployments—presents a critical decision point, balancing operational overhead, control, and cost. Tactical implementation hinges on efficient data ingestion using tools like Beats, Logstash, and Kafka; meticulous index design and mapping; and robust Index Lifecycle Management (ILM) for handling time-series data, especially through hot-warm-cold-frozen architectures that leverage cost-effective cloud object storage via searchable snapshots.
Performance in the cloud is dictated by judicious shard sizing, effective query tuning that often involves data denormalization, and leveraging various caching layers, with the OS filesystem cache playing a pivotal role. Security is paramount, necessitating a defense-in-depth approach that combines cloud provider network primitives (VPCs, security groups), encryption at rest and in transit (ideally using cloud KMS), robust authentication and authorization (potentially integrated with cloud IAM), and diligent auditing.
Cost optimization is an ongoing discipline, achieved by right-sizing instances, employing autoscaling where appropriate, optimizing data storage through ILM and searchable snapshots, refining query and ingestion efficiency to reduce compute load, and diligent monitoring of cloud spend using provider tools and resource tagging. Advanced use cases, including scalable log analytics, sophisticated application and semantic (vector) search for AI applications, real-time analytics with embedded machine learning, and seamless integration with the broader cloud data ecosystem (data lakes, Spark, BI tools), underscore Elasticsearch's versatility. By understanding these tactical and strategic dimensions, data engineers can effectively harness Elasticsearch to build powerful, scalable, and cost-efficient data solutions in the cloud.
1. Foundational Elasticsearch Concepts for Cloud Deployments
A solid grasp of Elasticsearch's core components is essential for data engineers aiming to design and implement robust solutions in cloud environments. These foundational elements directly influence scalability, data organization, search performance, and how applications interact with the engine, all of which are critical considerations in a distributed cloud setting.
1.1. Understanding Documents, Indices, and Inverted Indices: The Building Blocks
At the heart of Elasticsearch lie three fundamental concepts: documents, indices, and the inverted index. A document is the basic unit of information that can be indexed. It is expressed in JSON format and can be likened to a row in a traditional relational database, representing a specific entity. These entities are not limited to text; documents can encapsulate any structured data encoded in JSON, including numbers, strings, dates, and complex nested objects. Each document is uniquely identified by an ID and is associated with a data type that describes the kind of entity it represents, such as a product in an e-commerce catalog or a log entry from a web server. The flexibility of the JSON document structure is particularly advantageous in cloud environments where data engineers frequently encounter diverse and evolving data sources. This adaptability allows for quicker iteration on data products and reduces the friction typically associated with rigid schema definitions in data ingestion pipelines.
Documents are grouped into indices. An index is a collection of documents that share similar characteristics and is the highest-level entity against which queries are executed. Conceptually, an index is analogous to a database in a relational schema. Documents within a single index are generally logically related; for example, an e-commerce application might have separate indices for customers, products, and orders. The choice of how to structure data into indices significantly impacts data organization, query scope, and management strategies like Index Lifecycle Management (ILM).
The mechanism enabling Elasticsearch's renowned search speed is the inverted index. Instead of searching text directly, Elasticsearch searches this specialized data structure. An inverted index maps content, such as individual words or numerical values, to the documents in which they appear. During indexing, Elasticsearch tokenizes the content of documents (e.g., splits text fields into words) and builds a list of all unique terms. For each term, it records the documents that contain it. This structure functions like a hashmap, providing a fast lookup from a term to the relevant documents. The efficiency of the inverted index is a cornerstone of Elasticsearch's performance, especially in distributed cloud architectures. When combined with sharding, queries can be processed in parallel across segments of inverted indices residing on different cloud nodes, making near real-time search and analytics on massive datasets feasible—a common requirement for data engineering tasks like log analytics and real-time application monitoring.
1.2. Nodes, Clusters, Shards, and Replicas: Architecting for Cloud Scalability and Resilience
Elasticsearch is inherently designed as a distributed system, and its architecture for scalability and resilience revolves around nodes, clusters, shards, and replicas. An Elasticsearch cluster is a collection of one or more server instances, known as nodes, that are connected and work together. The collective power of a cluster lies in its ability to distribute tasks, such as indexing new data and executing search queries, across all its constituent nodes.
A node is a single server that stores data and participates in the cluster's indexing and search capabilities. Nodes can be configured with different roles, defining their specific responsibilities within the cluster. Common roles include:
Master Node: Responsible for managing the cluster, handling operations like creating or deleting indices, and adding or removing nodes.
Data Node: Stores data and executes data-related operations like search and aggregation. Data nodes can be further specialized into data_hot, data_warm, data_cold, and data_frozen roles to support tiered data architectures.
Ingest Node: Can pre-process documents before the actual indexing occurs, applying transformations or enrichments.
Client Node (or Coordinating Node): Forwards cluster requests to the master node and data-related requests to the appropriate data nodes, offloading some work from data and master nodes.
Machine Learning Node: Dedicated to running machine learning jobs. The ability to assign specialized roles to nodes is a powerful mechanism for strategic resource allocation in the cloud. Different Elasticsearch operations have varying resource demands (CPU, RAM, I/O). By assigning specific roles, data engineers can match cloud instance types (e.g., CPU-optimized, memory-optimized, storage-optimized) to the workload of those roles. For instance, master nodes might be smaller, cost-effective instances, while data_hot nodes, which handle active indexing and frequent queries, could be high-performance instances with fast SSDs. Conversely, data_cold nodes might utilize instances with cheaper, high-capacity storage. This granular control over resource allocation is a key advantage for optimizing both performance and cost in cloud deployments.
To handle large volumes of data and distribute workload, an index can be divided into multiple pieces called shards. Each shard is, in itself, a fully functional and independent "index" that can be hosted on any data node within the cluster. When a document is indexed, it is stored in one primary shard. The number of primary shards for an index is determined at the time of index creation and cannot be changed later without reindexing. Sharding allows Elasticsearch to scale horizontally; as data grows or query load increases, more nodes can be added to the cluster, and shards can be distributed across them. This also enables parallel processing of queries, as different shards can be queried simultaneously.
For data redundancy and high availability, Elasticsearch allows the creation of one or more copies of an index's shards, known as replica shards or simply replicas. A replica shard is a copy of a primary shard. Replicas are never allocated to the same node as their primary shard, protecting against data loss in case of a node failure. Replicas also serve to increase read capacity, as search requests can be handled by either primary or replica shards. The number of replicas can be changed dynamically. The sharding and replication model has a direct and significant impact on cloud costs and the ability to meet performance and availability Service Level Agreements (SLAs). Each shard consumes resources (memory, disk space), and each replica effectively doubles the storage requirement for its primary shard, while also adding network traffic for the replication process. An excessive number of small shards can lead to "shard overallocation," increasing overhead and potentially straining master nodes and JVM heap resources, which in a cloud context translates to needing larger, more expensive instances. Conversely, too few, very large shards can limit parallelism and become performance bottlenecks. Replicas enhance read throughput and resilience but come at the cost of increased storage and potentially higher write latency. Data engineers must therefore strategically balance these factors, carefully considering cloud instance sizes, provisioned storage, and inter-node communication costs. This balance is not merely an Elasticsearch configuration detail but a critical aspect of cloud resource management.
1.3. Key APIs for Data Engineers: The Interface to Elasticsearch Power
Elasticsearch provides a comprehensive and powerful set of RESTful APIs that allow users to interact with the cluster for a wide range of operations. For data engineers, these APIs are the primary means of programmatically managing data, building ingestion pipelines, executing complex queries, and administering the cluster in cloud environments.
Key categories of APIs include:
Document APIs: These APIs are used for Create, Read, Update, and Delete (CRUD) operations on individual documents. They also support batch operations like bulk for indexing or updating multiple documents in a single request, mget for retrieving multiple documents by ID, updateby_query for updating documents matching a query, deleteby_query for deleting documents matching a query, and reindex for copying documents from one index to another, potentially transforming them in the process. The bulk API is particularly crucial for efficient high-throughput data ingestion.
Search APIs: These enable the execution of search queries, ranging from simple full-text searches to complex queries involving multiple criteria, filtering, and scoring. Search APIs also support features like suggesters (for autocomplete functionality), ranking evaluation, and explaining why a document matched (or did not match) a query.
Aggregations APIs: The aggregations framework allows for the computation of aggregated data based on a search query. It provides building blocks (metrics, bucket, pipeline, and matrix aggregations) that can be composed to build complex summaries and analytics over the data. This capability transforms Elasticsearch from a simple search engine into a potent analytical tool. Data engineers often leverage aggregations to derive insights, build dashboards (frequently via Kibana), and perform near real-time analytics directly within Elasticsearch, reducing the need to extract data to separate analytical systems for many common tasks. This in-place analytics capability is a significant tactical and strategic advantage.
Ingest APIs: These APIs allow for the management of ingest pipelines, which are sequences of processors that transform documents before they are indexed. The _simulate pipeline API is useful for testing these pipelines.
Management APIs: This broad category includes APIs for managing indices (creating, deleting, configuring settings and mappings), managing the cluster and its nodes, handling licensing and security configurations, and more. The _cat APIs provide human-readable, tabular output for various cluster statistics and states, which is useful for ad-hoc monitoring and diagnostics.
The fundamentally RESTful nature of these APIs makes Elasticsearch exceptionally well-suited for integration into cloud-native architectures and microservices. Cloud applications often consist of loosely coupled services communicating via HTTP/REST. Data engineers building pipelines that connect various cloud services (e.g., AWS Lambda functions, Azure Functions, Google Cloud Functions, streaming services like Kinesis or Pub/Sub, or applications running on VMs or containers) can easily interact with Elasticsearch. This simplifies integration efforts, promotes interoperability within the diverse cloud ecosystem, and aligns with modern architectural patterns, allowing data engineers to call Elasticsearch from scripts, serverless functions, or applications written in virtually any programming language.
2. Strategic Cloud Deployment Models for Elasticsearch
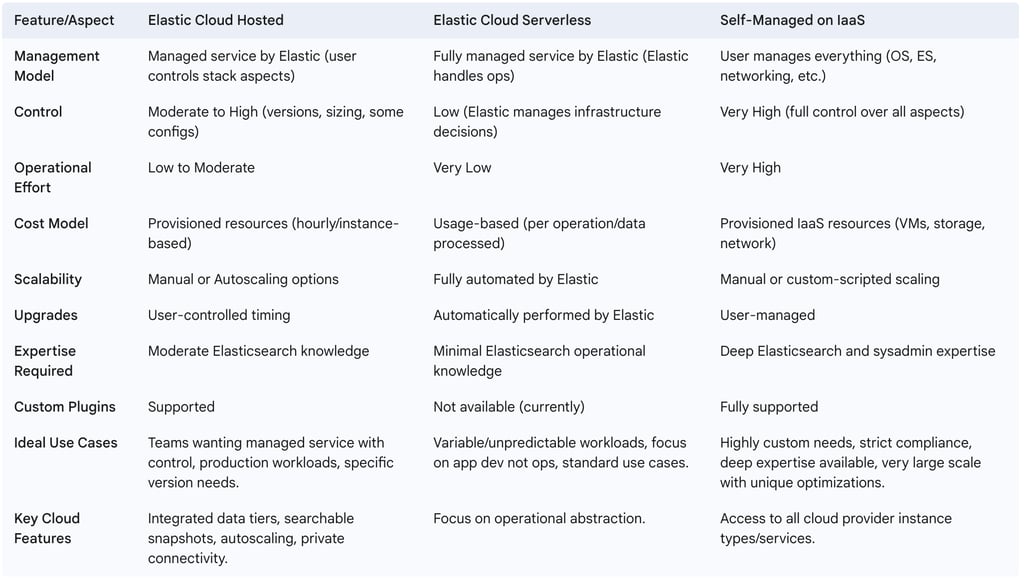
Choosing the right cloud deployment model for Elasticsearch is a foundational strategic decision for data engineers. The choice impacts operational responsibilities, control over the environment, cost structures, scalability, and the availability of specific features. The primary options include managed services offered by Elastic, and self-managing Elasticsearch on Infrastructure-as-a-Service (IaaS) platforms.
2.1. Elastic Cloud Hosted: The Official Managed Service
Elastic Cloud Hosted is the official managed Elasticsearch service from Elastic, the creators of Elasticsearch. It is available on major cloud providers, including Amazon Web Services (AWS), Google Cloud Platform (GCP), and Microsoft Azure. This service bundles Elasticsearch with Kibana and other components of the Elastic Stack, providing a comprehensive platform for search, analytics, and observability.
With Elastic Cloud Hosted, users retain control over key aspects such as Elastic Stack version upgrades, deployment configurations (including hardware profiles like CPU Optimized instances), sizing, and snapshot management. This level of control allows data engineers to tailor the environment to specific needs. At the same time, the service aims to reduce operational overhead by managing the underlying infrastructure. Features like autoscaling, integrated data tiers with searchable snapshots utilizing cloud object storage, cross-cluster search, cross-cluster replication, and built-in monitoring are readily available, often deeply integrated with the underlying cloud provider's capabilities.
For many data engineering teams, Elastic Cloud Hosted strikes a strategic balance between control and convenience. Pure IaaS (self-managed) deployments offer maximum control but also entail the maximum operational burden. Conversely, fully abstracted services (like the Serverless model discussed next) minimize operational tasks but offer less control over the underlying infrastructure or specific versioning. Data engineering teams often require a degree of control—for instance, over specific Elasticsearch versions for compatibility with other systems, the ability to install certain plugins, or fine-grained selection of hardware profiles—while simultaneously wishing to offload routine maintenance tasks such as OS patching, backup orchestration, and node failure recovery. Elastic Cloud Hosted caters to this need, allowing teams to focus more on data modeling, application integration, and leveraging advanced Elasticsearch features rather than on the intricacies of infrastructure management.
Furthermore, the cloud-enabled features provided by Elastic Cloud Hosted are significant value-adds that go beyond core Elasticsearch functionality. Capabilities such as autoscaling, which dynamically adjusts deployment capacity to meet storage and performance needs, and the seamless integration of data tiers with searchable snapshots on cloud object storage, are complex to implement and manage robustly in a self-hosted environment. Elastic Cloud Hosted builds these features natively into the service, leveraging the strengths of the chosen cloud platform. For example, searchable snapshots directly utilize cost-effective cloud object storage for cold and frozen data tiers, while autoscaling helps optimize costs and maintain performance under fluctuating loads. This provides data engineers with access to sophisticated, cloud-optimized capabilities with reduced development and operational effort, enabling them to build more resilient, scalable, and cost-effective data solutions more rapidly.
2.2. Elastic Cloud Serverless: A Fully Managed, Usage-Based Approach
Elastic Cloud Serverless represents a more recent offering from Elastic, aiming to provide a fully managed, hands-off experience. In this model, Elastic takes responsibility for all operational aspects, including version upgrades, sharding strategy, scaling, node management, and backups. The key differentiator is its pricing model, which is based on usage rather than provisioned resources, and its architectural approach, which abstracts away infrastructure decisions from the user. The primary goal is to free users from operational responsibility, allowing them to focus solely on ingesting and querying their data.
This serverless approach fundamentally alters how data engineers approach capacity planning and cost management. Traditional deployments, including Elastic Cloud Hosted to some extent, necessitate upfront resource provisioning (nodes, storage, memory). This often leads to either over-provisioning to handle peak loads (resulting in idle, paid-for resources) or under-provisioning that can cause performance degradation. Elastic Cloud Serverless, by abstracting all infrastructure decisions and automatically managing capacity, shifts this paradigm. The usage-based pricing model means that costs directly correlate with actual consumption, which can be highly cost-effective for workloads that are spiky, unpredictable, or intermittent—scenarios sometimes encountered in data engineering, such as periodic batch processing jobs or ad-hoc analytical queries. This model also significantly lowers the barrier to entry for experimentation, as there is no need to set up and pay for idle infrastructure.
However, the simplicity offered by Elastic Cloud Serverless comes with a trade-off in terms of control and customization, which can be a critical consideration for certain data engineering requirements. While the service aims to "just work" by abstracting operational complexities, data engineers may sometimes need specific Elasticsearch versions for compatibility, the ability to install custom plugins , or fine-grained control over sharding, replication, or low-level configurations for advanced performance tuning. The feature set for Serverless is evolving, with some capabilities listed as "Planned" , indicating ongoing development. Data engineers must carefully evaluate whether the current capabilities of Serverless align with their specific technical needs. For standard use cases centered on search, observability, or security that do not require deep customization, Serverless can be a compelling option. For highly specialized or complex data applications, Elastic Cloud Hosted or a self-managed deployment might still be more appropriate. The organizational model in Serverless, which uses separate projects for Elasticsearch, Observability, and Security, also differs from the single deployment, multi-capability model of Elastic Cloud Hosted.
2.3. Self-Managed Elasticsearch on IaaS (AWS, Azure, GCP): Maximum Control, Maximum Responsibility
Self-managing Elasticsearch involves deploying and operating the software on virtual machines (e.g., AWS EC2, Azure Virtual Machines, Google Compute Engine) provided by cloud IaaS platforms. This approach grants the user complete control over every aspect of the deployment, including the Elasticsearch version, configuration parameters, operating system, networking setup, and security hardening. However, this maximum control comes with maximum responsibility: the user's team is accountable for all operational tasks, such as initial installation, upgrades, OS patching, scaling the cluster (both up/down and out/in), configuring and managing backups, setting up comprehensive monitoring, and handling node failures and recovery.
While self-managing can appear to offer lower costs in terms of raw infrastructure, especially when leveraging reserved instances or spot instances from cloud providers , this assessment must consider the "expertise threshold." The direct infrastructure costs might be lower, but the total cost of ownership (TCO) includes significant "hidden costs" related to the engineering time required for operations, potential downtime due to misconfigurations or slow recovery from failures, and the need for a team with deep Elasticsearch and systems administration expertise. As suggests, for those already proficient with Elasticsearch, a managed service might only be appealing for smaller clusters; for larger or more complex setups where the team has the skills, self-management can be viable. However, if such expertise is lacking, the perceived infrastructure savings can be quickly overshadowed by operational inefficiencies, extended downtime, or critical data loss.
The primary allure of self-management is the unfettered access it provides, enabling deep optimization and integration that might not be possible with managed services. Managed services, by design, abstract or restrict certain low-level configurations or API endpoints to maintain stability and manageability for a diverse customer base. Self-hosting removes these constraints, allowing data engineers to fine-tune every aspect of the cluster, utilize any community or custom plugins, access the very latest instance types or specialized hardware (e.g., instances with specific CPU architectures or local NVMe drives that might not yet be offered by managed services), and integrate with other systems, including legacy or proprietary ones, in highly customized ways. For cutting-edge use cases, demanding performance requirements that necessitate specific hardware or OS tuning, or complex integrations within a unique cloud environment, self-management might be the only path. However, this power is coupled with the substantial and ongoing responsibility of ensuring the cluster's stability, security, performance, and scalability—a significant undertaking that should not be underestimated.
2.4. Table: Comparison of Cloud Deployment Models
To aid data engineers in making an informed strategic choice, the following table summarizes the key characteristics, advantages, and disadvantages of the discussed cloud deployment models for Elasticsearch.
3. Tactical Data Ingestion and Management in the Cloud
Effective data ingestion and lifecycle management are crucial for any successful Elasticsearch deployment, particularly in cloud environments where data volumes can grow rapidly and storage costs are a key consideration. This section delves into practical strategies for getting data into Elasticsearch and managing it throughout its lifecycle.
3.1. Designing Efficient Data Ingestion Pipelines in the Cloud
Data ingestion is a core responsibility for data engineers. Building efficient, scalable, and resilient ingestion pipelines is fundamental to leveraging Elasticsearch for search, analytics, and observability in the cloud. Various tools and patterns can be employed, each with its strengths and best-fit scenarios.
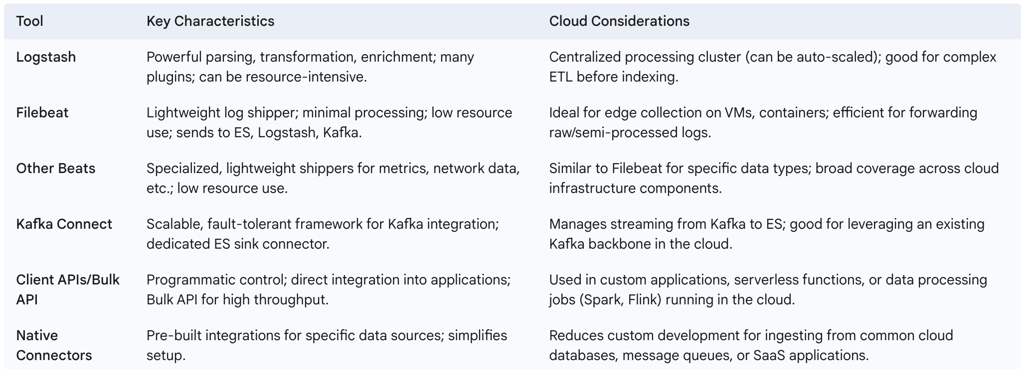
3.1.1. Logstash, Filebeat, and other Beats Logstash is a powerful open-source data processing pipeline that can ingest data from a multitude of sources, transform it, and then send it to various destinations, including Elasticsearch. Its flexibility stems from a rich ecosystem of input, filter, and output plugins, making it suitable for complex parsing and enrichment tasks, often as part of an ELK (Elasticsearch, Logstash, Kibana) or EFK (Elasticsearch, Fluentd, Kibana) stack. However, Logstash can be resource-intensive, especially when performing complex transformations on high-volume data streams.
Filebeat, and other members of the Beats family (e.g., Metricbeat for metrics, Packetbeat for network data), are lightweight data shippers designed to run on edge nodes (such as cloud virtual machines, containers, or IoT devices) with minimal resource consumption. Filebeat specifically tails log files and forwards the log data to a central Logstash instance for further processing, directly to Elasticsearch if parsing requirements are minimal or handled by ingest pipelines, or to a message queue like Apache Kafka for buffering. Filebeat can perform some basic filtering and metadata enrichment before sending data. It is also designed to work with Index Lifecycle Management (ILM) for time-series data.
A common and scalable cloud architecture involves deploying lightweight Beats on numerous distributed sources to collect logs and metrics. These Beats then ship the data to a centralized Logstash cluster (which can be auto-scaled within the cloud environment) for more intensive parsing, transformation, and enrichment, or directly to Elasticsearch Ingest Nodes if the processing logic is suitable for Elasticsearch's native ingest capabilities. This decoupled architecture allows for independent scaling of the data collection and data processing tiers, optimizing resource utilization and cost. Data engineers can deploy Beats widely across their cloud infrastructure with a minimal footprint, while concentrating the more computationally demanding processing tasks on a managed, scalable central component.
3.1.2. Elastic Native Connectors and Client APIs Elastic provides Elastic Native Connectors and a Connector Framework designed to simplify the process of ingesting data from various sources into Elasticsearch. These connectors aim to provide pre-built, optimized pathways for common data stores and services.
For custom applications or integration with bespoke data processing frameworks (such as Apache Spark or Apache Flink running in the cloud), Elasticsearch offers official client APIs in several programming languages (e.g., Java, Python,.NET, Ruby, Go). These APIs provide a convenient way to interact with Elasticsearch programmatically, including indexing data. The Bulk API is a critical feature accessible through these clients (or directly via REST), allowing for the efficient indexing or updating of multiple documents in a single HTTP request, which is essential for achieving high throughput during data ingestion.
The development of native connectors and the connector framework by Elastic signifies a strategic effort to streamline integration with a diverse array of data sources, many of which are cloud-based (e.g., cloud databases, message queues, object storage, SaaS applications). For data engineers, this can significantly accelerate the development of search and analytics applications by reducing the amount of custom code needed for data ingestion. It allows them to focus more on the transformation logic and the ultimate utilization of the data within Elasticsearch, rather than on the lower-level mechanics of data movement, particularly when dealing with common cloud data services.
3.1.3. Integrating with Kafka (Kafka Connect) Apache Kafka is a distributed streaming platform often used as a high-throughput, fault-tolerant message bus in modern data architectures. Kafka Connect is a framework included with Kafka for scalably and reliably streaming data between Kafka and other systems, and it provides connectors for various sources and sinks, including Elasticsearch. Data can be produced to Kafka topics from numerous sources, and then Kafka Connect, using an Elasticsearch sink connector, can efficiently write this data into Elasticsearch.
This pattern of using Kafka as a resilient buffer between data producers and Elasticsearch is particularly valuable in cloud environments dealing with high-volume or spiky data streams. Filebeat and Logstash can also integrate with Kafka; Filebeat can act as a producer sending logs to Kafka, and Logstash can act as a consumer reading from Kafka topics and then processing and sending the data to Elasticsearch.
Employing Kafka as an intermediary buffer before Elasticsearch is a critical architectural pattern for achieving resilience and managing backpressure in cloud-scale ingestion pipelines. Directly ingesting data from a multitude of sources into Elasticsearch can risk overwhelming the cluster during load spikes or if Elasticsearch experiences temporary performance degradation or unavailability. Kafka, as a distributed, fault-tolerant, and persistent commit log, decouples the data producers from Elasticsearch. Producers write data to Kafka topics, and consumers (such as Logstash, Kafka Connect, or custom applications) read from Kafka at a pace suitable for Elasticsearch to ingest. This decoupling ensures that data ingestion can continue even if Elasticsearch is slow or temporarily unavailable, as Kafka absorbs bursts and provides durability, thereby preventing data loss. For data engineers building robust cloud systems, this pattern significantly enhances the reliability and scalability of the entire data ingestion path. It also offers the flexibility of having multiple independent consumers for the same data stream if other systems or applications need access to it.
3.1.4. Table: Data Ingestion Tools: Use Cases and Characteristics
3.2. Index Design and Mapping Best Practices
The way data is structured within an Elasticsearch index, defined by its mapping, profoundly affects search relevance, query performance, storage efficiency, and analytical capabilities. For data engineers, meticulous index design and mapping are critical tactical responsibilities.
3.2.1. Dynamic vs. Explicit Mapping: Making the Right Choice Elasticsearch offers two primary approaches to defining the structure of documents within an index: dynamic mapping and explicit mapping. Dynamic mapping allows Elasticsearch to automatically detect the data type of fields in incoming documents and create the corresponding mappings. For example, if a field contains a value that looks like a date, Elasticsearch might map it as a date type. If new fields are encountered in subsequent documents, Elasticsearch will automatically add them to the mapping. This is convenient for getting started quickly, especially when the schema is not fully known or is highly variable. Users can also define dynamic templates to apply custom mapping rules to dynamically added fields based on naming conventions or data types.
Explicit mapping, on the other hand, involves pre-defining the data type and other attributes for each field in an index. This approach is strongly recommended for production environments as it gives data engineers full control over how data is indexed and stored, ensuring it is optimized for the specific use case. Explicit mapping allows for precise definitions, such as specifying which string fields should be treated as full-text (text type) for linguistic analysis versus those that should be treated as exact values (keyword type) for filtering, sorting, or aggregations. It also enables the definition of numeric types, date formats, geolocations, and the use of specialized types like geo_point or geo_shape that cannot always be reliably inferred dynamically. Furthermore, explicit mapping is necessary for configuring custom analyzers for language-specific text processing or optimizing fields for partial matching. A combination of dynamic and explicit mapping can be useful, where known parts of the schema are explicitly defined, while other, more unpredictable sections might leverage dynamic mapping or dynamic templates.
While dynamic mapping offers initial convenience, data engineers should view explicit mapping as establishing a crucial "data contract" for their indices. Dynamic mapping can sometimes infer incorrect data types (e.g., misinterpreting a numeric string as a number when it should be a keyword, or choosing a suboptimal date format), which can lead to unexpected search behavior, indexing errors down the line, or inefficient storage. Explicit mapping forces a clear and unambiguous definition of field types, analyzers, and other indexing properties. This ensures that data is indexed consistently and correctly according to its intended use, thereby improving data quality, the predictability of search results, and enabling fine-tuned performance optimizations. It is a proactive measure against future data integrity issues and performance bottlenecks.
3.2.2. Optimizing Mappings for Search, Aggregation, and Storage Effective mapping design goes beyond just defining data types; it involves optimizing fields for their intended use in searches, aggregations, and for efficient storage. A common and powerful technique is to use multi-fields, allowing the same source field to be indexed in multiple ways. For instance, a string field like product_name could be mapped as a text field for full-text search (allowing for analysis like stemming and tokenization) and simultaneously as a keyword field for exact matching, sorting, or use in term aggregations.
Careful consideration should be given to numeric fields. While types like integer or long are optimized for range queries, if a numeric identifier is primarily used for exact matching (e.g., in term queries) and not for range searches, mapping it as a keyword type can often yield better performance.
To optimize storage and indexing performance, fields that are never searched upon can have indexing disabled by setting index: false in their mapping. Similarly, the source field, which stores the original JSON document, can be disabled to save storage space. However, disabling source has implications: it prevents reindexing from the source, updates that rely on the source document, and the ability to retrieve the original document. For keyword fields that might contain very long strings, the ignore_above parameter can be used to prevent indexing of terms longer than a specified character limit, which helps avoid excessive growth of the inverted index. Features like date_detection (automatic mapping of date-like strings) and numeric_detection (automatic mapping of string-encoded numbers) can be configured or disabled to prevent unintended mappings.
The choices made during mapping have a direct and tangible impact on cloud resource consumption. Indexing unnecessary fields, using inefficient data types (e.g., mapping all string fields as text with analysis when many are only used for exact matches or aggregations and would be better as keyword), or failing to optimize field storage increases the size of the inverted index and the overall data stored. Larger indices consume more disk space (a direct cloud storage cost) and require more memory for caching. Queries against poorly mapped fields can be slower, consuming more CPU resources (a direct cloud compute cost). Therefore, thoughtful mapping is a key lever for cost optimization in the cloud. Data engineers should treat mapping design as an integral part of the optimization process, not merely as a schema definition task. This requires a deep understanding of how the data will be queried and a careful balance between desired features and the associated storage and compute costs.
3.2.3. Index Patterns: Wildcards and Date Math for Time-Series Data For managing and querying time-series data, such as logs or metrics, which are often stored in indices named with a temporal component (e.g., logs-YYYY.MM.DD), Elasticsearch supports index patterns. These patterns allow queries to target multiple indices simultaneously. Wildcards (* or ?) are commonly used in index patterns. For example, logs-* would match all indices starting with "logs-", while logs-2023.01.* would match all log indices from January 2023.
Date math expressions provide a powerful way to define index patterns that resolve to specific dates or time ranges dynamically based on the current time. For instance, an index pattern like <logs-{now/d-7d}> would target the log index from seven days ago (relative to "now," rounded down to the day). This is extremely useful for creating queries that look at rolling time windows without needing to change the query string itself. The format is <static_name-{date_math_expression{date_format|time_zone}}>.
Best practices for using index patterns include keeping them up-to-date as new indices are created or old ones are retired. For greater flexibility and to simplify application logic, index aliases are often preferred over direct use of wildcard patterns in application code. An alias can point to one or more physical indices, and this mapping can be changed without affecting the applications querying the alias. For performance, it's advisable to make index patterns as specific as possible to avoid querying unnecessary indices.
While index patterns with wildcards and date math are useful, index aliases provide a more robust and flexible abstraction layer for managing the lifecycle and querying of time-series data, especially in dynamic cloud environments. Time-series data typically involves the regular creation of new indices (e.g., daily through a rollover process) and the eventual retirement or deletion of old ones (managed by ILM). Relying solely on wildcard patterns embedded in application code can necessitate frequent code updates if naming conventions, retention periods, or the set of active indices change. Index aliases, however, offer a stable logical name (e.g., current_logs or last_30_days_logs) that can point to a dynamically changing set of underlying physical indices. Operations like index rollover, which is a core part of ILM, seamlessly update these aliases. This decouples querying applications from the physical index naming strategy and makes operational tasks like migrating data between different storage tiers transparent to the applications. This abstraction is crucial for maintaining agility and simplifying application development and maintenance in cloud deployments handling time-series data.
3.2.4. Preventing Mapping Explosions A "mapping explosion" occurs when an index mapping grows excessively large due to an extremely high number of distinct field names. This can lead to severe performance degradation, high memory consumption (especially on master nodes that hold the cluster state), and even out-of-memory errors, making the cluster unstable and difficult to recover. Dynamic mapping can exacerbate this issue if incoming documents frequently introduce new, unanticipated fields.
To prevent mapping explosions, Elasticsearch provides several settings to limit the complexity of mappings within an index template or index settings:
index.mapping.total_fields.limit: Restricts the maximum number of fields in an index (default is 1000).
index.mapping.depth.limit: Limits the maximum depth of a field, including nested objects (default is 20).
index.mapping.nested_fields.limit: Constrains the maximum number of distinct nested type mappings (default is 50).
index.mapping.nested_objects.limit: Defines the maximum number of nested JSON objects within a single document across all nested types (default is 10000).
Data engineers should set sensible values for these limits, particularly if dynamic mapping is enabled for parts of their indices. Regularly reviewing index mappings for field bloat is also a good practice. If documents are becoming excessively wide (too many fields) or too deeply nested, it might indicate a need to restructure the data or reconsider what information is truly necessary to index.
A mapping explosion is not merely an error condition; it represents a critical scalability and cost issue in cloud deployments. Each field defined in an index mapping consumes memory on nodes (especially master nodes responsible for maintaining the cluster state) and adds to the overall complexity of managing that state. Uncontrolled growth in the number of fields, often stemming from highly variable user-generated data or overly permissive dynamic mapping settings, can lead to insidious performance degradation and cluster instability long before any hard limits are explicitly hit. In a cloud context, this translates directly into needing larger, more expensive instances for master and data nodes simply to cope with bloated mappings, or facing increased risks of cluster instability and operational firefighting. Therefore, data engineers must proactively design their schemas and configure appropriate mapping limits to prevent such explosions. This is not just about avoiding errors but about ensuring the long-term scalability, stability, and cost-efficiency of the Elasticsearch cluster in the cloud. It may also necessitate data governance discussions around the necessity and structure of indexed fields.
3.3. Index Lifecycle Management (ILM) in the Cloud
Index Lifecycle Management (ILM) is a powerful feature in Elasticsearch designed to automate the management of indices, particularly time-series data such as logs, metrics, or event data, throughout their lifespan. This is especially critical in cloud environments for optimizing resource utilization, controlling storage costs, and ensuring data is handled according to retention policies.
3.3.1. Defining ILM Policies: Phases and Actions ILM works by defining policies that specify different phases an index can transition through, and the actions to be performed in each phase. These policies are then applied to index templates, so new indices automatically inherit the lifecycle rules. The typical phases in an ILM policy are :
Hot: The phase for actively indexing new data and handling frequent queries. Indices in this phase usually reside on the highest-performance hardware.
Warm: Data is typically no longer being written to indices in this phase, but they are still queried, though perhaps less frequently. These indices might be moved to less performant, more cost-effective hardware.
Cold: Indices are seldom queried and can be moved to even cheaper, slower storage. Search performance may be impacted.
Frozen: Data is very rarely accessed. Indices in this phase are typically backed by searchable snapshots residing in low-cost object storage, minimizing their footprint on the cluster's local disks. Searches are possible but will be slower.
Delete: Indices are removed from the cluster according to the defined retention period.
A Content Tier also exists, which is generally for data that isn't time-series and doesn't typically move through these lifecycle phases.
Within each phase, various actions can be configured, such as :
Rollover: Creates a new index when the current active (hot) index meets certain criteria (e.g., maximum age, maximum size, or maximum number of documents).
Allocate: Moves the index's shards to nodes with specific attributes (e.g., to nodes designated for the warm or cold tier).
Shrink: Reduces the number of primary shards in an index (useful for older, read-only indices to reduce overhead).
Force Merge: Optimizes index segments by merging them into fewer, larger segments, which can improve search performance on read-only indices and free up disk space.
Set Priority: Defines the recovery priority for an index if a node restarts.
Freeze: Makes an index read-only and minimizes its memory footprint, typically used before moving to the frozen data tier.
Searchable Snapshot: Creates a snapshot of the index that can be searched directly from a snapshot repository (usually cloud object storage).
Delete: Permanently removes the index.
Data engineers can define ILM policies via the Kibana UI or using the Elasticsearch REST API, tailoring the phases, transition triggers (e.g., min_age), and actions to match their specific data access patterns, performance requirements, and retention policies.
3.3.2. Rollover, Shrink, Force Merge, and Searchable Snapshots These ILM actions are particularly important for managing time-series data effectively:
Rollover is fundamental for continuous ingestion of time-series data. Instead of writing to a single, ever-growing index, ILM can automatically create a new index (e.g., logs-000002 after logs-000001 reaches a defined size or age) and update an alias to point to the new active index. This keeps individual indices at a manageable size, which is crucial for performance and stability.
Shrink is useful for older indices that are no longer being written to and are primarily read-only. An index might have been created with multiple primary shards in the hot phase to handle high indexing throughput. In the warm or cold phase, these multiple shards can create unnecessary overhead. The shrink action reduces the number of primary shards (often to one), thereby reducing resource consumption.
Force Merge can be applied to read-only indices to reduce the number of Lucene segments per shard. Fewer segments generally lead to faster search performance and can also reclaim disk space occupied by deleted documents within segments. This is typically done in the warm or cold phases.
Searchable Snapshots are a key feature for cost-effective management of cold and frozen data tiers in the cloud. This action creates a snapshot of an index in a registered snapshot repository (typically cloud object storage like AWS S3, Google Cloud Storage, or Azure Blob Storage) and allows this snapshot to be mounted and searched with minimal data stored locally on the Elasticsearch nodes. This drastically reduces the local disk storage requirements for infrequently accessed historical data, leading to significant cost savings.
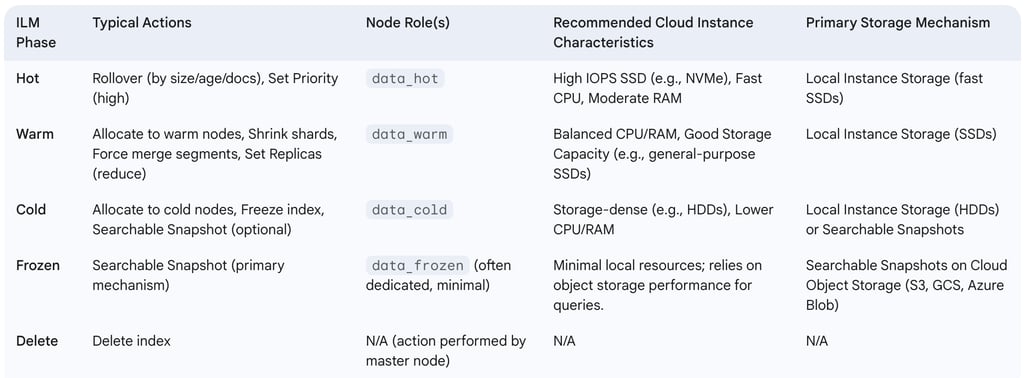
3.3.3. Implementing Hot-Warm-Cold-Frozen Architectures A hot-warm-cold-frozen architecture is a common strategy for balancing performance and cost when managing large volumes of time-series data. It is implemented by assigning specific data tier roles to different sets of nodes within the Elasticsearch cluster and using ILM policies to transition indices through these tiers. Node roles such as data_hot, data_warm, data_cold, and data_frozen are configured in the elasticsearch.yml file for each node (in self-managed deployments) or through the deployment configuration settings in managed services like Elastic Cloud.
Hot tier nodes are provisioned with the fastest hardware (e.g., high-IOPS SSDs, powerful CPUs) to handle active indexing and frequent, performance-sensitive queries.
Warm tier nodes can use less performant, more cost-effective hardware. Indices here are no longer updated but are still queried.
Cold tier nodes typically use even cheaper, higher-capacity storage. Queries are infrequent, and slower search performance is acceptable. Searchable snapshots can be heavily utilized here.
Frozen tier nodes rely almost exclusively on searchable snapshots, minimizing the local storage and memory footprint on the cluster. Data is rarely queried, and search latency is expected to be higher.
ILM policies then use the allocate action to move indices to nodes matching the appropriate tier attribute as they age or meet other criteria. This tiered approach, automated by ILM, is a cornerstone of cloud cost optimization for time-series data. It allows organizations to store vast amounts of data by aligning the cost of storage and compute with the data's value and access frequency. This makes long-term data retention economically feasible in the cloud without sacrificing the ability to query older data, albeit with potentially higher latency for data in colder tiers.
The effective implementation of ILM and tiered architectures also requires a conscious strategy for matching Elasticsearch node roles to appropriate cloud instance types. Cloud providers offer a wide variety of instance types optimized for different workloads (CPU-intensive, memory-intensive, I/O-intensive, storage-dense). Data engineers must strategically select cloud instance types that align with the resource requirements of each data tier. For example, hot tier nodes might use I/O-optimized instances with local NVMe SSDs (e.g., AWS i3en or r5d series). Warm tier nodes might use general-purpose or memory-optimized instances with standard SSDs (e.g., AWS r5 or m5 series). Cold and frozen tier nodes could use storage-dense instances with HDDs or minimal compute resources if relying heavily on searchable snapshots from object storage. This careful alignment of node roles, ILM policies, and cloud instance selection is crucial for achieving both the desired performance characteristics and cost-effectiveness of the hot-warm-cold-frozen architecture in a cloud setting.
3.3.4. Table: ILM Phases, Typical Actions, and Cloud Storage Considerations
4. Optimizing Elasticsearch Performance in Cloud Environments
Achieving optimal performance for Elasticsearch deployments in the cloud requires careful attention to several factors, from how data is sharded and allocated to how queries are constructed and how the cluster's resources are utilized and monitored. Inefficient configurations or queries can lead to slow response times, instability, and unnecessarily high cloud operational costs.
4.1. Shard Sizing and Allocation Strategies
The configuration of shards is one of the most critical factors influencing indexing speed, search latency, resource utilization, and overall cluster stability. An improper sharding strategy can lead to performance bottlenecks or excessive overhead.
4.1.1. Best Practices for Number of Shards and Shard Size General guidelines suggest aiming for shard sizes between 10GB and 50GB. For search-intensive use cases, shards in the 20-25GB range often perform well. These figures are not arbitrary; they represent a balance. Shards enable Elasticsearch to parallelize work across multiple nodes. However, each shard incurs a certain overhead in terms of metadata management and memory consumption within the JVM heap.
Having too many small shards (e.g., shards significantly less than 1GB) can lead to "shard overallocation." This increases the cluster state size, puts more pressure on the master node(s) to manage the metadata, and consumes more heap memory per gigabyte of data stored, potentially requiring larger and more expensive cloud instances for the same data volume. Conversely, having too few, very large shards (e.g., exceeding 50-100GB) can limit the degree of parallelism for search and indexing operations, make shard recovery and relocation processes slow and cumbersome if a node fails or during scaling events, and make it more difficult for Elasticsearch to evenly balance the data load across the available cloud nodes.
Since Elasticsearch version 7.x, the default number of primary shards per new index is 1, a change from the previous default of 5. This encourages more deliberate consideration of sharding needs. While a common heuristic is to aim for roughly 20 shards per GB of JVM heap memory allocated to data nodes, this is a guideline and not a strict rule, as the optimal number depends heavily on the specific use case, data volume, query patterns, and cluster size. The number of primary shards for an index is fixed at the time of its creation and cannot be changed later without reindexing the data into a new index with the desired shard count. The number of replica shards, however, can be adjusted dynamically.
For time-based indices, such as those used for logs or metrics, ILM rollover policies are essential for managing shard size. By configuring rollover based on maximum shard size, age, or document count, data engineers can ensure that individual indices (and thus their shards) do not grow excessively large. Continuous monitoring of actual shard sizes and adjusting index creation strategies or rollover policies accordingly is a key operational task. It is particularly important to avoid oversharding, especially on smaller cloud clusters where the overhead of many small shards can quickly outweigh any benefits of parallelism. Data engineers must design their sharding strategy to achieve a "sweet spot" that balances parallelism with overhead, thereby ensuring efficient use of provisioned cloud resources.
4.1.2. Resource-Based and Attribute-Based Shard Allocation Elasticsearch provides mechanisms to control where shards are allocated within the cluster. This is crucial for implementing tiered storage architectures (like hot-warm-cold) and for ensuring that shards are placed on appropriate hardware based on performance requirements or other criteria. Shard allocation filters allow control over shard placement based on custom node attributes (defined in elasticsearch.yml or via cloud deployment configurations) or built-in attributes such as name, host, ip, or tier.
The key index-level settings for controlling allocation are index.routing.allocation.include.*, index.routing.allocation.exclude.*, and index.routing.allocation.require.*, where * represents a node attribute. For example, an ILM policy might use an allocate action that requires shards in the "warm" phase to be placed on nodes having node.attr.tier: warm. These node attributes can then be mapped to different types of cloud instances (e.g., high-IOPS instances for "hot" nodes, storage-optimized instances for "cold" nodes). This gives data engineers fine-grained control over where data resides in the cloud, enabling optimization for both performance (by ensuring hot data is on fast storage) and cost (by moving colder data to cheaper storage). It also allows for workload isolation, preventing, for example, heavy indexing operations on hot nodes from impacting search performance on warm nodes if they are on physically separate hardware.
Other relevant allocation settings include index.unassigned.node_left.delayed_timeout, which delays shard reallocation when a node leaves the cluster (useful to prevent unnecessary shard movements during brief node restarts or network issues), and index.routing.allocation.total_shards_per_node, which limits how many shards from the same index can be allocated to a single node, helping to prevent hotspots and improve data distribution across cloud instances.
4.2. Query Tuning Techniques for Cloud-Scale Data
Inefficient queries can significantly degrade Elasticsearch performance, leading to slow application response times and increased cloud compute costs. Data engineers are often responsible for optimizing queries, whether for applications directly querying Elasticsearch or for analytical workloads.
4.2.1. Efficient Query Construction The way queries are written has a profound impact on their performance. Several best practices should be followed:
Filters over Queries for Non-Scoring Criteria: When a condition does not need to contribute to the relevance score of documents (e.g., filtering by a status field or a date range), it should be placed within a filter clause of a bool query rather than a must or should clause. Filters are generally faster as they don't compute scores and are often cached.
Avoid Leading Wildcards: Queries with leading wildcards (e.g., *term or ?term) are very inefficient as they cannot leverage the inverted index effectively and may require scanning many terms. If possible, redesign queries or use alternative approaches like ngram tokenizers at index time for partial matching, or consider fuzzy search for typos.
Minimize Joins: Elasticsearch is not a relational database, and join-like operations are expensive. nested queries, while useful for querying arrays of objects, can be several times slower than queries on flat documents. parent-child relationships are even more costly and can make queries hundreds of times slower. If possible, denormalize data at index time by including related information within the same document. This index-time effort often pays off significantly in query-time efficiency, leading to faster responses and lower CPU consumption (and thus lower costs) on the Elasticsearch cluster in the cloud. It's a strategic decision to shift complexity from read operations to write operations.
Optimize multi_match and query_string: When searching across multiple fields using query_string or multi_match, the more fields targeted, the slower the query tends to be. A common technique to improve performance is to use the copy_to mapping directive at index time to copy the values from several source fields into a single, combined field. Queries can then target this single field.
Use keyword for Identifiers: If an identifier field (e.g., a UUID, product ID) is not used for range queries, map it as a keyword type. term queries on keyword fields are often faster than term queries on numeric fields mapped as integer or long.
Avoid Scripts Where Possible: Scripts (e.g., for custom scoring, sorting, or in aggregations) provide great flexibility but can have a significant performance impact as they are typically executed per-document or per-value. If the logic can be achieved through standard query DSL or by pre-processing data at index time, those approaches are generally preferred.
4.2.2. Leveraging Caching Effectively Elasticsearch and the underlying operating system utilize several layers of caching to speed up query execution. Understanding and optimizing these caches is crucial.
Filesystem Cache (OS Level): This is often the most impactful cache for search performance. Elasticsearch relies on Lucene segments, which are files on disk. If these files (or frequently accessed parts of them) are present in the operating system's filesystem cache (held in RAM), read operations are significantly faster. It is a common best practice to allocate no more than 50% of a server's total RAM to the Elasticsearch JVM heap (up to a maximum of around 30-32GB of heap to benefit from compressed ordinary object pointers, or "compressed oops"). The remaining RAM should be left available for the operating system to use for its filesystem cache. When selecting cloud instances, data engineers should therefore choose instances with sufficient total RAM, not just enough to cover the JVM heap. Under-provisioning total RAM starves the filesystem cache, leading to increased disk I/O and slower queries. Additionally, ensuring that the disk readahead value is set to a sensible level (e.g., 128KiB) can prevent excessive, unnecessary read I/O and filesystem cache thrashing, especially when files are accessed via memory mapping.
Field Data Cache: This cache is stored in the JVM heap and is used primarily for sorting on fields and for aggregations on fields that do not have doc_values enabled (though doc_values are on by default for most field types except text and annotated_text fields). Unbounded growth of the field data cache can lead to JVM OutOfMemoryErrors. Its size can be limited using the indices.fielddata.cache.size setting (e.g., as a percentage of heap or a fixed size). Due to the prevalence of doc_values, reliance on the field data cache has diminished, but it's still important to be aware of.
Node Query Cache (Shard Request Cache): This cache stores the results of queries that are used in a filter context (i.e., non-scoring queries). It is an LRU (Least Recently Used) cache, meaning that when it fills up, the least accessed entries are evicted. Its size can be controlled by the indices.queries.cache.size setting. Ensuring that frequently used, non-scoring parts of queries are structured as filters can help maximize the utility of this cache.
4.2.3. Pre-computation and Data Enrichment at Index Time For queries that involve complex or frequently repeated calculations or aggregations, performance can often be improved by pre-computing these values during the data ingestion process and storing them as additional fields in the documents. For example, if dashboards frequently display aggregations over fixed price ranges, these price ranges could be determined at index time, and a price_range field could be added to each document. Queries would then perform a simpler terms aggregation on this pre-computed field instead of a more complex range aggregation on the original price field at query time.
This strategy of shifting computational load from query-time to index-time can lead to more predictable performance and potentially lower compute costs in the cloud. While it may increase storage requirements slightly (due to the extra indexed fields) and add some processing overhead during ingestion (which might run on separate, dedicated cloud resources or during off-peak hours), the benefits in query latency and reduced query-time CPU usage can be substantial. For data engineers dealing with read-heavy workloads where query performance is critical, this is a key optimization technique that can also help manage cloud compute costs effectively.
4.3. Monitoring Cluster Health and Performance in the Cloud
Continuous monitoring of an Elasticsearch cluster's health and performance is essential, not only for troubleshooting issues but also as a foundational practice for managing cloud costs and ensuring that Service Level Agreements (SLAs) are met. Key metrics to monitor include:
Cluster Health: Status (green, yellow, red), number of nodes, number of initializing/unassigned shards.
Node-Level Metrics: CPU utilization, JVM heap usage (especially important to watch for pressure near limits), garbage collection frequency and duration, disk space utilization (with alerts for high watermarks), disk I/O, network I/O.
Elasticsearch Queues: The depth of index, search, and bulk queues. Ideally, these queues should be nearly empty, indicating that requests are being handled promptly. Persistently deep queues signal a bottleneck.
Indexing Performance: Indexing rate (documents per second), indexing latency.
Search Performance: Search rate (queries per second), search latency (average, percentiles).
Cache Usage: Field data cache size and evictions, query cache size, hit rates, and evictions.
Tools for monitoring vary depending on the deployment model. Elastic Cloud Hosted and Serverless provide built-in monitoring capabilities, often integrated within Kibana's Stack Monitoring features. AWS Elasticsearch Service (now Amazon OpenSearch Service) includes integration with Amazon CloudWatch, though the set of metrics might be less comprehensive than dedicated Elasticsearch monitoring solutions. For self-managed deployments, a more comprehensive monitoring setup is required, potentially using tools like Prometheus with Grafana, commercial APM solutions, or Elastic's own monitoring tools configured for a separate monitoring cluster. Benchmarking tools like Rally can be used to analyze the impact of configuration changes on performance under controlled load.
In a cloud context, where resources are metered and billed based on usage, proactive monitoring is crucial. Performance issues often indicate inefficient resource utilization or the need for scaling adjustments. Without robust monitoring, it's difficult to identify performance bottlenecks, detect over-provisioned resources (which waste money), or spot under-provisioned resources (which risk SLA breaches and poor user experience). The data gathered from monitoring provides the necessary evidence to make informed decisions about scaling strategies, cloud instance type selection, query optimization efforts, and sharding configurations. Data engineers must establish comprehensive monitoring and alerting from the outset of any cloud deployment. This transforms operational management from a reactive, fire-fighting mode to a proactive approach focused on continuous optimization of performance and cost.
5. Securing Elasticsearch Deployments in the Cloud
Securing Elasticsearch clusters in cloud environments is a critical responsibility for data engineers. The distributed nature of Elasticsearch and the sensitivity of the data it often stores necessitate a multi-layered security approach, encompassing network isolation, data encryption, robust access control, and diligent operational practices.
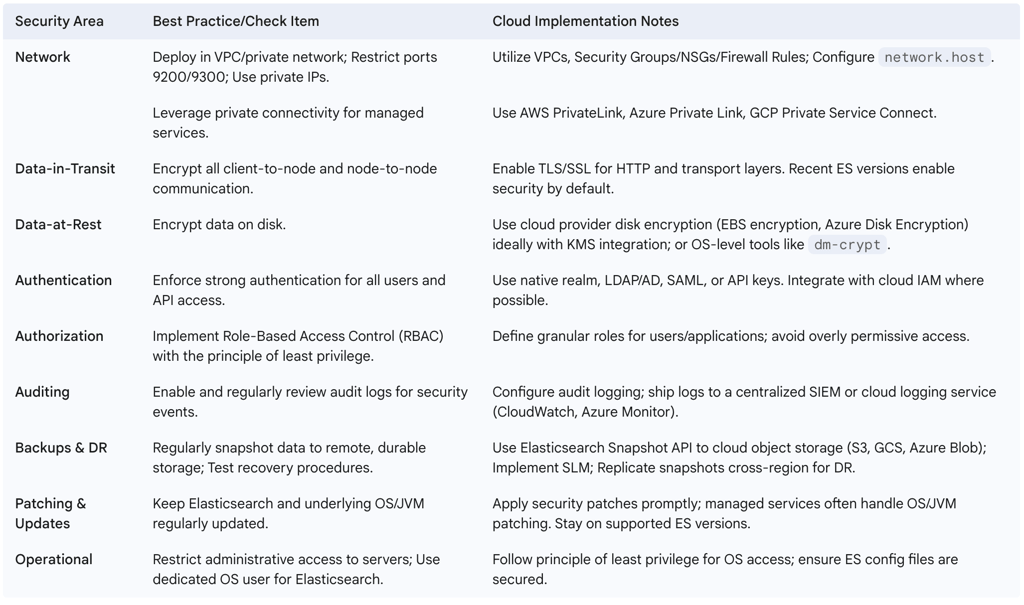
5.1. Network Security: Isolating Your Cluster
The first principle of Elasticsearch security is to prevent unauthorized network access. Elasticsearch clusters should never be exposed directly to the public internet unless absolutely necessary and with extreme caution. By default, recent versions of Elasticsearch bind to localhost to mitigate this risk. For cloud deployments, this means:
Deploying within a Virtual Private Cloud (VPC): Elasticsearch nodes should reside within a private network space (e.g., AWS VPC, Azure Virtual Network, GCP VPC Network).
Using Private IP Addresses: Configure Elasticsearch nodes to bind to private IP addresses using the network.host setting in elasticsearch.yml.
Restricting Port Access: The default Elasticsearch ports are 9200 for HTTP/REST API communication and 9300 for internal node-to-node (transport layer) communication. Access to these ports should be strictly controlled using cloud provider firewall services like AWS Security Groups, Azure Network Security Groups (NSGs), or GCP Firewall Rules. These rules should limit access to only trusted IP address ranges or specific security groups (e.g., application servers that need to query Elasticsearch).
Leveraging Private Connectivity: For managed services like Elastic Cloud, utilize private connectivity options such as AWS PrivateLink, Azure Private Link, or GCP Private Service Connect. These services allow access to the managed Elasticsearch endpoint from within your VPC without traversing the public internet.
Segmenting Security Groups: Consider using separate security groups or firewall rules for different types of traffic. For example, rules for internal cluster communication (port 9300) might be different from rules for client application access (port 9200).
Using a Proxy/Load Balancer: Placing a reverse proxy or a load balancer in front of client-facing Elasticsearch nodes (e.g., coordinating-only nodes) can provide an additional layer of security, request filtering, and SSL termination.
Disabling HTTP Where Not Needed: For nodes that do not need to expose the HTTP API (e.g., dedicated master nodes or data nodes in some configurations), HTTP can be disabled.
Leveraging these cloud provider network primitives (VPCs, security groups, private endpoints) is often more effective and easier to manage than relying solely on Elasticsearch's internal network configurations. These cloud-native controls provide a strong perimeter defense before traffic even reaches the Elasticsearch nodes, simplifying management and benefiting from the cloud provider's robust security infrastructure and expertise.
5.2. Data Encryption: At Rest and In Transit
Protecting data from unauthorized access requires encryption both when it is moving across the network (in transit) and when it is stored on disk (at rest).
Encryption in Transit: Communication between nodes within an Elasticsearch cluster and between clients and the cluster should be encrypted using TLS/SSL. Recent versions of Elasticsearch automatically configure security features, including encryption for communication, during initial setup. It is crucial to ensure TLS is enabled for all cluster traffic to prevent eavesdropping and man-in-the-middle attacks.
Encryption at Rest: Data stored on the disks of Elasticsearch nodes should also be encrypted. For self-managed deployments, Elasticsearch itself does not provide built-in disk encryption by default. This requires using operating system-level tools like dm-crypt on Linux (which enables full-disk encryption via LUKS) or leveraging the disk encryption capabilities offered by cloud providers (e.g., AWS EBS encryption, Azure Disk Encryption, Google Cloud Persistent Disk encryption). Managed Elasticsearch services like Elastic Cloud and Amazon OpenSearch Service typically offer encryption at rest as a standard feature, often with options for Bring Your Own Key (BYOK).
When implementing encryption at rest for self-managed clusters, integrating with cloud provider Key Management Services (KMS) — such as AWS KMS, Azure Key Vault, or Google Cloud KMS — significantly simplifies the complex and critical task of managing encryption keys. These services handle key creation, rotation, access control, and secure storage, offloading a significant security burden from the data engineering team and ensuring keys are managed according to industry best practices. This often aids in meeting compliance requirements. Data engineers should prefer using cloud provider-managed disk encryption or leverage managed Elasticsearch services that provide robust encryption-at-rest capabilities.
5.3. Authentication and Authorization: Controlling Access
Once network access is secured, it is vital to ensure that only authenticated and authorized users and applications can interact with the Elasticsearch cluster and access its data.
Authentication: This is the process of verifying the identity of a user or application. Elasticsearch security features (formerly X-Pack, now part of the default distribution with a Basic license) enable user authentication, requiring credentials (e.g., username/password, API keys, tokens) to access the cluster. Elasticsearch supports various authentication mechanisms, known as realms, including:
Native realm (users and roles stored within Elasticsearch)
Active Directory realm
LDAP realm
PKI (Public Key Infrastructure) realm
SAML (Security Assertion Markup Language) realm
Kerberos realm. Elastic Cloud Hosted allows user management of authentication realms, while Elastic Cloud Serverless typically manages users at the organizational level with SAML support being a common option.
Authorization (Access Control): Once a user is authenticated, authorization determines what actions they are permitted to perform and what data they can access. Elasticsearch employs Role-Based Access Control (RBAC). Administrators define roles, each with a specific set of privileges (e.g., read access to certain indices, ability to manage cluster settings, permission to create snapshots). Users or API keys are then assigned to these roles. The principle of least privilege should always be applied: grant only the permissions necessary for a user or application to perform its intended functions.
Operational Security: Administrative access to the underlying servers and the Elasticsearch configuration files must be tightly controlled. The operating system user running the Elasticsearch process (often named elasticsearch) should have restricted permissions and own all Elasticsearch files and directories. Anonymous access to the cluster should be disabled (it is rejected by default in secure configurations).
Where feasible, integrating Elasticsearch authentication and authorization with the cloud provider's Identity and Access Management (IAM) system (e.g., AWS IAM for Amazon OpenSearch Service ) can centralize user management and leverage existing corporate identity governance structures. This simplifies administration, enforces consistent access policies across cloud resources, and reduces the operational overhead of maintaining a separate set of credentials and roles within Elasticsearch itself.
5.4. Auditing and Monitoring for Security Events
Audit logging provides a chronological record of activities performed within the Elasticsearch cluster, which is invaluable for security analysis, compliance, and troubleshooting. Audit logs can capture events such as authentication attempts (successful and failed), access to data, administrative changes (e.g., modifying user roles or index settings), and query execution. Elastic Cloud Hosted provides audit logging capabilities, and it is a planned feature for Serverless deployments. For self-managed clusters, audit logging needs to be explicitly configured.
These audit logs should be regularly reviewed and, ideally, shipped to a secure, centralized logging system for analysis and long-term retention. This could be another Elasticsearch cluster dedicated to security logging (as part of a SIEM solution like Elastic Security) or a cloud-native logging service (e.g., AWS CloudTrail, AWS CloudWatch Logs, Azure Monitor Logs, Google Cloud's operations suite). Integrating Elasticsearch audit logs into a broader cloud Security Information and Event Management (SIEM) strategy transforms auditing from a passive compliance activity into an active component of threat detection. By correlating Elasticsearch audit events with logs from other cloud resources (networks, VMs, identity providers), security teams can detect anomalous access patterns, unauthorized modification attempts, or other signs of compromise in near real-time, enabling a faster and more effective response.
5.5. Backup and Disaster Recovery Strategies in the Cloud
Protecting against data loss due to hardware failure, accidental deletion, or malicious attacks requires a robust backup and disaster recovery (DR) strategy. Elasticsearch's primary mechanism for backups is the snapshot feature. Snapshots are point-in-time copies of indices or the entire cluster. Best practices include:
Regular Snapshots: Configure regular, automated snapshots.
Remote Storage: Store snapshots in a remote, durable, and cost-effective location, separate from the live cluster. Cloud object storage services (AWS S3, Google Cloud Storage, Azure Blob Storage) are the de facto standard for this purpose due to their high durability, scalability, and relatively low cost. Elasticsearch has built-in repository plugins for these services.
Snapshot Lifecycle Management (SLM): Use SLM policies (available in Kibana or via API) to automate the creation, retention, and deletion of snapshots according to defined schedules and retention periods.
Cross-Region Replication for DR: For disaster recovery, snapshots can be replicated from the primary cloud region to a secondary region.
Testing Recovery: Regularly test the process of restoring data from snapshots to ensure the backup strategy is effective and meets Recovery Time Objectives (RTO) and Recovery Point Objectives (RPO).
Managed Elasticsearch services often provide automated backup solutions. For example, AWS Elasticsearch Service (Amazon OpenSearch Service) includes daily automated snapshots to S3. Elastic Cloud Hosted allows users to manage their snapshot configurations, while Elastic Cloud Serverless handles backups automatically. Utilizing cloud object storage for snapshots simplifies backup management, improves data durability, and provides a cost-effective solution for meeting RPO/RTO objectives, effectively decoupling backup storage from the live cluster's operational storage.
5.6. Table: Cloud Security Best Practices Checklist for Elasticsearch
6. Cost Optimization for Elasticsearch in the Cloud
Running Elasticsearch in the cloud offers immense scalability and flexibility, but it also necessitates careful attention to cost management. Data engineers play a crucial role in implementing strategies to control and reduce operational expenditures without compromising performance or availability.
6.1. Leveraging Data Tiers and ILM for Storage Cost Reduction
One of the most effective strategies for managing storage costs, especially for time-series data like logs and metrics, is the implementation of a tiered data architecture using Index Lifecycle Management (ILM). As data ages and its access frequency diminishes, ILM can automatically transition it through different storage tiers:
Hot Tier: For new, frequently accessed, and actively indexed data. This tier typically uses high-performance, more expensive storage (e.g., fast SSDs).
Warm Tier: For data that is no longer being updated but is still queried. This can reside on slightly less performant, more cost-effective storage.
Cold Tier: For infrequently accessed data where slower query performance is acceptable. This tier often utilizes cheaper, higher-capacity storage like HDDs.
Frozen Tier: For very rarely accessed historical data. This tier heavily relies on searchable snapshots, which store the bulk of the index data in low-cost cloud object storage (e.g., AWS S3, Google Cloud Storage, Azure Blob Storage), with only minimal metadata and frequently accessed data cached locally.
The searchable snapshots feature is particularly transformative for cloud storage cost optimization. Storing terabytes or petabytes of historical data on performant block storage attached directly to Elasticsearch nodes is often economically prohibitive in the cloud. Cloud object storage is significantly cheaper. Searchable snapshots allow Elasticsearch to query data directly from these snapshots residing in object storage, drastically reducing the need for expensive local disk space for cold or frozen data. This capability enables organizations to retain vast amounts of data for compliance, historical analysis, or occasional querying at a fraction of the cost of keeping it all on "hot" storage, making long-term data retention strategies economically viable in the cloud. Data engineers should aggressively utilize ILM to move data through these tiers, making extensive use of searchable snapshots for the frozen tier.
6.2. Right-Sizing Instances and Autoscaling
Ensuring that cloud instances provisioned for Elasticsearch nodes are appropriately sized for the workload is fundamental to cost control. Over-provisioning leads to paying for unused capacity, while under-provisioning results in performance issues.
Right-Sizing: Continuously monitor key performance indicators such as CPU utilization, memory usage (both JVM heap and system memory for filesystem cache), disk I/O, and network traffic for all node types (master, data, ingest, etc.). Based on these metrics, select cloud instance families and sizes that best match the workload profile of each tier or node role. For example, hot data nodes might require I/O-optimized or compute-optimized instances, while cold data nodes might benefit from storage-optimized instances. If certain node types, like dedicated machine learning nodes, are provisioned but not actively used, they should be scaled down or removed.
Autoscaling: Managed Elasticsearch services like Elastic Cloud often provide autoscaling capabilities that can dynamically adjust cluster capacity (e.g., number of data nodes or storage per node) based on predefined metrics or schedules. This can help match resource allocation more closely to actual demand, potentially saving costs during periods of low activity and ensuring performance during peak loads. However, autoscaling is not a "set and forget" solution. The policies governing scaling actions (thresholds for scaling up or down, cooldown periods, instance types to add) need to be carefully configured and tuned based on workload patterns. Aggressive scaling might lead to instability or frequent, costly scaling events ("flapping"), while overly conservative scaling might not respond quickly enough to load spikes. Data engineers need to understand their workload characteristics and continuously monitor and adjust autoscaling parameters to achieve an optimal balance between performance and cost.
6.3. Optimizing Data Ingestion and Queries to Reduce Compute Costs
The efficiency of data ingestion processes and search queries directly impacts the computational load on the Elasticsearch cluster, which in turn affects cloud compute costs.
Query Optimization: As discussed in the performance section, avoiding costly query operations (such as scripts, deeply nested queries or aggregations, or queries over unnecessarily broad data ranges or irrelevant fields) can significantly reduce CPU and memory consumption. Every CPU cycle saved translates to potential cost savings in the cloud.
Ingestion Optimization: Efficient data ingestion involves using bulk requests to index multiple documents at once rather than indexing them individually. Client configurations should be optimized for batching. If using tools like Logstash, ensure that processing pipelines are efficient and that transformations are handled appropriately, perhaps shifting some to Elasticsearch ingest nodes if that reduces overall resource consumption. For ETL/ELT tools like Airbyte, leveraging features such as incremental updates (processing only new or changed data), data deduplication before loading, efficient data transformations, filtering unnecessary data at the source, and intelligent data partitioning or routing can reduce the load on Elasticsearch and associated costs.
In cloud environments, compute resources are a direct and often significant cost component. Data engineers must view performance optimization not just as a means to improve user experience but also as a critical discipline for controlling operational expenditure. This requires a deep understanding of how Elasticsearch processes data and executes queries, and a continuous effort to refine both ingestion pipelines and query patterns.
6.4. Snapshot Management and Archival to Lower-Cost Storage
While snapshots are crucial for backup and disaster recovery, their storage also incurs costs. Effective snapshot management involves:
Storing in Low-Cost Object Storage: Always configure snapshot repositories to use cloud object storage (S3, GCS, Azure Blob), which is significantly cheaper than block storage attached to nodes.
Snapshot Lifecycle Management (SLM): Implement SLM policies to automate the creation, retention, and deletion of snapshots. Retain snapshots only for as long as necessary based on RPO and compliance requirements.
Differentiating "Searchable Cold" from "True Archive": For data that is extremely rarely accessed and primarily retained for long-term compliance or archival purposes (with no immediate need to be searchable via Elasticsearch), consider moving the snapshot files themselves from standard cloud object storage tiers to even cheaper archive tiers (e.g., Amazon S3 Glacier, S3 Glacier Deep Archive, Azure Archive Storage, Google Cloud Archive Storage). This is distinct from searchable snapshots, which keep data queryable from standard object storage. Transitioning to true archive tiers can yield substantial additional savings for very cold data but will require restoring the snapshot to a standard object storage tier before it can be accessed by Elasticsearch. Data engineers should collaborate with business and compliance teams to classify data retention needs and implement a nuanced strategy that might involve moving snapshots from "searchable cold" (on standard object storage) to "pure archive" (on archive-tier object storage) as data ages further.
6.5. Monitoring and Managing Cloud Spend
Proactive monitoring of cloud costs is essential for any Elasticsearch deployment.
Utilize Cloud Provider Tools: Leverage the cost management and billing tools provided by your cloud provider (e.g., AWS Cost Explorer, AWS Budgets, Azure Cost Management and Billing, Google Cloud Billing reports). These tools offer visibility into spending patterns and can help identify cost drivers.
Resource Tagging: Implement a consistent and granular tagging strategy for all cloud resources associated with your Elasticsearch deployment (compute instances, storage volumes, object storage buckets, network components, etc.). Tags allow for accurate cost allocation and tracking by environment (dev, staging, prod), project, service, or data tier. This is fundamental for understanding which parts of the Elasticsearch architecture contribute most to the cost and for enabling effective chargeback or showback to business units. Without proper tagging, a cloud bill can be a monolithic figure, offering little actionable insight for optimization.
Budget Alerts: Set up budget alerts within your cloud provider's billing console to be notified when spending exceeds predefined thresholds.
Regular Review: Periodically review cloud costs, correlating them with Elasticsearch operational metrics (e.g., data volume growth, query rates, indexing throughput) to understand the relationship between usage and expenditure and to identify new areas for optimization.
6.6. Table: Cloud Cost Optimization Checklist for Elasticsearch
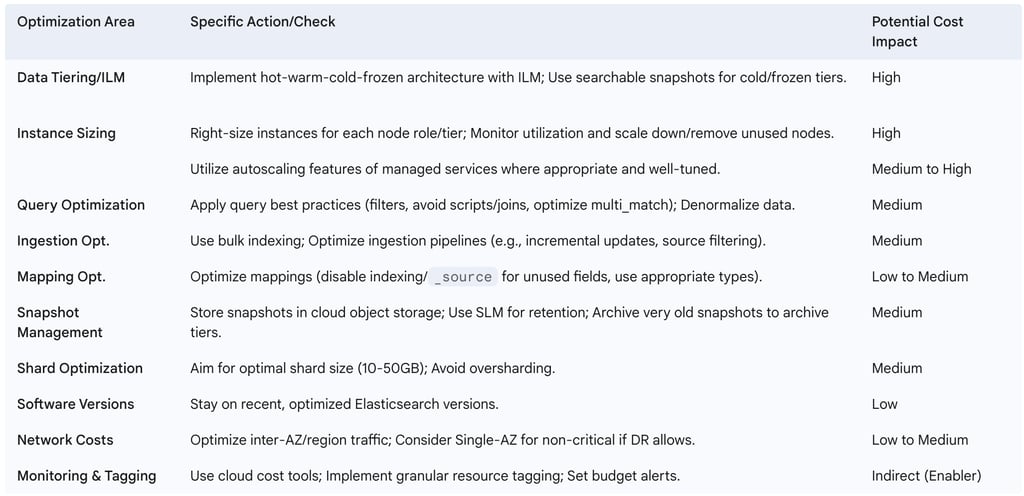
7. Advanced Use Cases and Cloud Integrations
Elasticsearch's versatility extends beyond basic search, enabling sophisticated applications and seamless integration with the broader cloud data ecosystem. Data engineers can leverage these capabilities to build powerful, scalable solutions for log analytics, application and semantic search, real-time analytics, and more.
7.1. Building Scalable Log Analytics Solutions
Elasticsearch is a cornerstone technology for real-time log analytics and monitoring. The ELK Stack (Elasticsearch, Logstash, Kibana) or EFK Stack (substituting Fluentd for Logstash) provides a popular and powerful architecture for centralizing, processing, storing, and visualizing log data from diverse sources across a cloud environment. The typical workflow involves:
Ingestion: Logs are collected from applications, servers (VMs, containers), network devices, and cloud services using agents like Filebeat (a lightweight shipper) or directly by Logstash/Fluentd.
Processing: Logstash or Fluentd parse the raw log messages, extract structured fields, enrich the data (e.g., with geo-IP information or metadata), and transform it into a consistent format (typically JSON).
Storage & Indexing: Processed logs are sent to Elasticsearch, where they are indexed into time-based indices (e.g., daily or hourly indices like applogs-YYYY-MM-DD).
Analysis & Visualization: Kibana is used to search, analyze, and visualize the log data through dashboards, graphs, and interactive queries, enabling operations teams to monitor system health, troubleshoot issues, and identify trends.
Key challenges in cloud-based log analytics include managing the sheer scale of log data, ensuring efficient centralization from distributed sources, and controlling costs. Index Lifecycle Management (ILM) with data tiering (hot-warm-cold-frozen) is crucial for managing storage costs by moving older, less frequently accessed logs to cheaper storage tiers, often leveraging searchable snapshots on cloud object storage. Autoscaling for Logstash/Fluentd processing nodes and Elasticsearch data nodes can help manage fluctuating log volumes.
Data engineers should also consider leveraging cloud-native logging services as an alternative or complement to self-managed log ingestion components. Services like AWS Kinesis Data Firehose (which can deliver data directly to Amazon OpenSearch Service or an Elasticsearch cluster), Azure Event Hubs with a sink to Elasticsearch, or Google Cloud Logging with exports to Pub/Sub (which can then feed Elasticsearch) can simplify the ingestion pipeline. These managed services often handle scaling, durability, and integration with other cloud services automatically, potentially reducing the operational burden of managing a self-hosted Logstash or Fluentd cluster. This allows data engineers to focus more on the Elasticsearch and Kibana aspects of the solution—data modeling, search optimization, and dashboard creation. However, cloud-native services might offer less flexibility in terms of custom parsing logic compared to a dedicated Logstash/Fluentd setup, so a hybrid approach may sometimes be optimal.
7.2. Implementing Efficient Application Search and Semantic Search (Vector Search)
Elasticsearch excels at powering search within applications, from e-commerce product search and website content search to enterprise-wide document retrieval. The "Search Applications" feature in Kibana, along with associated APIs and client libraries (like the JavaScript client ), simplifies the development of search-powered applications by providing tools for creating search templates and UIs.
Beyond traditional keyword-based search, Elasticsearch is increasingly used for semantic search through vector search capabilities. Semantic search aims to understand the meaning and context of a user's query, rather than just matching keywords. This is achieved by:
Generating Embeddings: Using machine learning models (often deep learning models like transformers), unstructured data (text, images, audio) is converted into dense numerical vector representations called embeddings. These embeddings capture the semantic meaning of the data.
Indexing Vectors: These vector embeddings are stored in Elasticsearch in a special field type (e.g., dense_vector).
Performing Similarity Search: When a user issues a query, the query itself is also converted into an embedding using the same ML model. Elasticsearch then uses Approximate Nearest Neighbor (ANN) algorithms to find the vectors in the index that are closest (most similar) to the query vector in the embedding space.
Vector search overcomes the limitations of keyword search, allowing users to find relevant information even if their query doesn't use the exact terms present in the documents. Use cases include more relevant product recommendations, question-answering systems, and image similarity search. Elasticsearch can function as a powerful vector database, storing and searching billions of embeddings. The Elasticsearch Relevance Engine (ESRE) provides a toolkit for building AI-powered search applications, including capabilities for generating embeddings, integrating with external Large Language Models (LLMs), implementing hybrid search (combining lexical and vector search), and using various transformer models.
For data engineers, implementing semantic search typically involves setting up a pipeline to generate embeddings for their content (this might involve using pre-trained models, fine-tuning models, or integrating with cloud ML services for model hosting and inference) and then indexing these embeddings into Elasticsearch. Queries will then use Elasticsearch's k-Nearest Neighbor (kNN) search capabilities.
A significant trend in advanced search is hybrid search, which combines the strengths of traditional lexical search (like BM25, which excels at keyword matching) with semantic vector search. Lexical search ensures that documents containing exact keywords are found, while semantic search captures contextual relevance. By combining scores from both types of search, often using techniques like Reciprocal Rank Fusion (RRF), hybrid search can deliver more robust and relevant results than either method alone. Data engineers building modern search applications in the cloud should architect their systems to support hybrid search. This involves indexing data appropriately for both lexical analysis (e.g., using text fields with suitable analyzers) and semantic analysis (e.g., storing embeddings in dense_vector fields).
Furthermore, Elasticsearch's role as a vector database is becoming strategically important for powering Retrieval Augmented Generation (RAG) in Generative AI and LLM applications built in the cloud. LLMs, while powerful, can sometimes produce factually incorrect information ("hallucinate") or may lack knowledge of very recent or domain-specific information. RAG addresses this by first retrieving relevant context from a knowledge base (a corpus of documents) and then providing this context to the LLM as part of the prompt when it generates a response. Vector search is ideal for this retrieval step, semantically matching the user's query or prompt to the embeddings of documents in the knowledge base. Elasticsearch can serve as this vector database, efficiently storing, filtering, and searching these embeddings at scale. This positions Elasticsearch as a key component in the evolving GenAI stack for data engineers working on AI/ML projects in the cloud.
7.3. Real-time Analytics and Anomaly Detection with Elasticsearch ML
Elasticsearch is not just a search engine but also a capable real-time analytics engine. Its built-in Machine Learning (ML) capabilities further enhance this by enabling anomaly detection, outlier detection, forecasting, classification, and regression directly on the data stored within Elasticsearch. Elastic ML offers:
Unsupervised Learning: Particularly useful for time-series anomaly detection (e.g., identifying unusual spikes or dips in metrics or log volumes), population analysis (finding entities that behave differently from their peers), and forecasting trends based on historical data.
Supervised Learning: Allows training classification models (e.g., for fraud detection, sentiment analysis, or log message categorization) and regression models (e.g., for predicting numerical values) using labeled data.
Ease of Use: Many ML jobs can be configured through the Kibana UI with pre-built models, requiring no prior ML expertise. For more advanced use cases, users can adjust parameters or even import their own trained models from frameworks like PyTorch.
These ML capabilities are deeply integrated into Elastic solutions like Elastic Observability (for AIOps, including automated anomaly detection and root cause correlations) and Elastic Security (for ML-powered threat detection and hunting).
For data engineers, implementing these features involves ingesting the relevant data (system metrics, application logs, business transaction data, security events) into Elasticsearch. Then, Elastic ML jobs can be configured to continuously analyze this data, detect anomalies or patterns, and trigger alerts or actions. This "in-cluster ML" approach accelerates the path from data to actionable insights by reducing the need to move data to separate, external ML systems for many common use cases. It simplifies the MLOps pipeline for tasks like time-series anomaly detection or log categorization, as data movement and complex model deployment processes are minimized. This is particularly valuable in dynamic cloud environments where rapid response to anomalies in system behavior, security threats, or business metrics is critical.
7.4. Integrating Elasticsearch with the Broader Cloud Data Ecosystem
In most cloud architectures, Elasticsearch does not operate in isolation. Data engineers frequently need to integrate it with other data stores, processing engines, and business intelligence tools to create comprehensive data solutions.
7.4.1. Connecting with Data Lakes (e.g., AWS S3) Cloud data lakes, typically built on object storage services like AWS S3, Azure Data Lake Storage (ADLS), or Google Cloud Storage (GCS), serve as central repositories for vast amounts of raw and processed data. Elasticsearch integrates with these services in several ways:
Snapshot Repositories: As mentioned, Elasticsearch can use cloud object storage for storing snapshots, which is essential for backup, DR, and also for searchable snapshots in ILM.
Data Ingestion from Data Lakes: Data stored in a data lake (e.g., Parquet files, CSVs, JSON logs in S3) can be ingested into Elasticsearch for search and real-time analytics. This can be done using custom scripts (e.g., Python scripts using Boto3 for S3 and the Elasticsearch client), stream processing pipelines involving Kafka Connect, or data integration tools like Airbyte which can read from S3 and write to Elasticsearch.
Data Export to Data Lakes: Data from Elasticsearch (e.g., aggregated results, historical data being retired from active tiers) can be exported to the data lake for long-term archival, further batch processing by other engines (like Spark), or ad-hoc querying using data lake query services (like Amazon Athena or Presto). This can be achieved by restoring snapshots to a staging area, using tools like Airbyte, or via custom Spark jobs that read from Elasticsearch and write to S3.
This integration is increasingly bidirectional. Elasticsearch can read from the data lake tier (via searchable snapshots) and also serve as a source for data offloaded to the data lake. This allows data engineers to design flexible architectures where Elasticsearch acts as a high-performance serving layer for interactive search and real-time analytics, while the data lake functions as the primary, cost-effective storage hub for raw data and batch processing workloads. Data flows between these systems based on access patterns, processing requirements, and cost considerations, creating a dynamic and optimized cloud data ecosystem.
7.4.2. Processing with Apache Spark Apache Spark is a powerful distributed processing framework widely used for large-scale data transformation, batch processing, stream processing, and machine learning. The elasticsearch-hadoop (or elasticsearch-spark) connector enables seamless integration between Spark and Elasticsearch. With this connector, Spark applications (often running on managed cloud services like Amazon EMR, Azure Databricks, or Google Cloud Dataproc) can:
Read data from Elasticsearch: Elasticsearch indices can be treated as a data source for Spark DataFrames or RDDs. This allows for complex analytics, transformations, or ML model training on data stored in Elasticsearch that might go beyond Elasticsearch's native aggregation capabilities.
Write data to Elasticsearch: Spark can process data from various sources (data lakes, databases, streaming systems) and then efficiently write the transformed or enriched results into Elasticsearch for indexing.
Pass queries to Elasticsearch: Spark can push down certain query predicates to Elasticsearch to filter data at the source, reducing the amount of data transferred to Spark for processing.
Best practices for Spark-Elasticsearch integration include partitioning data effectively in Elasticsearch to enable parallel reads by Spark, caching frequently accessed RDDs/DataFrames in Spark's memory, and leveraging Elasticsearch's filtering capabilities in queries initiated from Spark to minimize data movement. Spark serves as a potent tool for complex data preparation and enrichment tasks before data is indexed into Elasticsearch, or for performing sophisticated batch analytics on data extracted from it. This division of labor—Spark for heavy-duty, general-purpose distributed processing and Elasticsearch for specialized search and real-time analytics on prepared data—is a common and effective pattern in cloud data architectures.
7.4.3. Visualization with Tableau and Power BI For business intelligence and data visualization, Elasticsearch data can be made accessible to popular BI tools like Tableau and Microsoft Power BI. This allows business users and analysts to explore Elasticsearch data, create interactive dashboards, and generate reports without needing to write complex Elasticsearch DSL queries.
Tableau: Connectors, such as those provided by CData, enable Tableau Desktop, Tableau Server, and Tableau Cloud to connect to Elasticsearch. These connectors often translate Tableau's visual query building or custom SQL into Elasticsearch queries (either DSL or SQL if using Elasticsearch's SQL interface). They can support live connections for real-time data or data extracts for offline analysis and performance optimization.
Power BI: Similarly, connectors (e.g., from CData or via standard ODBC drivers) allow Power BI Desktop and Power BI Service to connect to Elasticsearch. These can operate in Import mode (copying data into Power BI) or DirectQuery mode (querying Elasticsearch live). The connectors may push down supported SQL operations to Elasticsearch for efficiency.
These connectors play a crucial role in abstracting the underlying complexities of Elasticsearch's query language and document-oriented structure. They expose Elasticsearch data in a more relational or tabular format that BI tools can easily consume, thereby democratizing access to the valuable insights held within Elasticsearch for a broader range of users within an organization. This enables data engineers to deliver self-service analytics capabilities on top of their Elasticsearch deployments.
Conclusions and Recommendations
Elasticsearch offers a robust and versatile platform for data engineers to tackle a wide array of challenges in cloud environments, from real-time log analytics and application monitoring to sophisticated application search, semantic search with vectors, and advanced analytics powered by machine learning. Its distributed architecture, RESTful APIs, and rich feature set make it a natural fit for the scalability, flexibility, and dynamic nature of the cloud.
Strategic Imperatives:
Deployment Model Selection: The choice between Elastic Cloud Hosted, Elastic Cloud Serverless, and self-managed IaaS deployments is a pivotal strategic decision. Teams must weigh their operational expertise, need for control, cost sensitivity, and the nature of their workloads. Managed services (Hosted for control with convenience, Serverless for ultimate simplicity and usage-based pricing) are often preferable for reducing operational burden, while self-management offers maximum customization at the cost of significant operational responsibility.
Embrace Tiered Architectures: For any significant time-series data workload (logs, metrics, events), implementing a hot-warm-cold-frozen architecture using ILM and leveraging cloud object storage via searchable snapshots is not just a best practice but a strategic necessity for managing costs effectively in the cloud.
Prioritize Security from Day One: Security in the cloud is a shared responsibility. Data engineers must proactively implement a defense-in-depth strategy, combining cloud provider network security primitives (VPCs, security groups), data encryption (in transit and at rest, ideally using cloud KMS), robust authentication and authorization (RBAC, integrating with cloud IAM where possible), and diligent auditing.
Integrate with the Cloud Ecosystem: Elasticsearch should not be viewed in isolation. Strategic advantage comes from its integration with other cloud services, including data lakes (for bidirectional data flow), distributed processing engines like Spark (for complex data preparation and analytics), and BI tools (for democratizing data access).
Tactical Recommendations for Data Engineers:
Master Core Concepts: A deep understanding of documents, indices, sharding, replication, and the role of the inverted index is fundamental to effective design and troubleshooting.
Optimize Ingestion Pipelines: Choose appropriate ingestion tools (Beats, Logstash, Kafka, native connectors, APIs) based on data sources, volume, and processing needs. Leverage Kafka as a resilient buffer for high-throughput streams.
Invest in Mapping Design: Use explicit mappings for production indices to ensure data integrity and optimize for search, aggregation, and storage. Utilize multi-fields and be mindful of preventing mapping explosions. Employ index aliases for managing time-series data.
Tune for Performance and Cost Concurrently:
Sharding: Aim for shard sizes between 10-50GB. Avoid oversharding. Use ILM rollover to manage shard growth.
Querying: Write efficient queries using filters, avoiding costly operations like scripts and joins where possible. Denormalize data at index time.
Caching: Ensure sufficient system memory for the OS filesystem cache. Understand and monitor Elasticsearch internal caches.
Resource Sizing: Right-size cloud instances for different node roles/tiers. Utilize autoscaling in managed services judiciously
Automate with ILM: Extensively use ILM for managing time-series data, automating transitions between storage tiers, and actions like rollover, shrink, force merge, and searchable snapshots.
Monitor Diligently: Implement comprehensive monitoring for cluster health, performance metrics, and cloud costs. Use this data to proactively optimize the deployment.
Leverage Advanced Features: Explore Elasticsearch's capabilities for semantic (vector) search to power AI-driven applications and its built-in machine learning for anomaly detection and AIOps.
By combining strategic foresight in architectural choices with tactical diligence in implementation and ongoing management, data engineers can effectively harness the power of Elasticsearch in the cloud to deliver high-performance, scalable, secure, and cost-efficient data solutions that drive business value. Continuous learning and adaptation to new features and cloud provider offerings will be key to long-term success.